


Following the tradition of financial literature, I would like to put a disclaimer to this note. I consider stocks to be one of the best investing tools in the long term. I also consider myself to be a fundamental investor. I use information about the company’s financial and operational performance to decide if it is a good investment opportunity or not. However, my concern is that many people, including those who have already made their initial steps in investing, may underestimate the challenges of investing. Because of that, they are on a path towards mediocre investment results. In the following piece, I tried to highlight those less-known challenges to make all fellow investors aware of them and potentially improve their results.
The stats that are worth knowing before you start investing
The problem almost all investors face within the first few years after starting active investing is that their actual track record falls short of market returns and could even turn negative. As doubts begin to emerge, investors start considering alternative investment methods, especially if they read in the press about ‘successful’ hedge fund managers or hear some of their friends made over 100% gains in a short period in…(bitcoin, CFDs, cannabis, real estate, put any other random asset that could go up by pure chance including GameStop). Some of those ‘unlucky’ investors decide to change ‘religion’, switching to investments based on macro analysis, technical or, probably, the best alternative – to passive investing (especially if they choose an ETF tracking a broad market like S&P or MSCI World). Some investors remind themselves of the importance of having a long-term focus, consistency and discipline and keep doing the same thing without a noticeable improvement in performance. As a result, they get even more anxious putting their investment skills and intellectual capabilities into doubt, fighting their ego in the meantime, which does not let them accept their limitations so easily.
Don’t worry; I am one of these investors, having struggled with fundamental analysis for a while, much longer than I hoped for until I made this interesting discovery. Hopefully, you are reading this note relatively early so that you can learn about the real dangers of investing before committing a large share of your net worth to this activity.
It all starts quite simple. Stocks are the best investment option for people with a long-term horizon beating all other asset classes over the long term (10-30 years and more). There is plenty of empirical evidence, and it is intellectually appealing to those who like studying and analysing things.
As a minimum, you think to yourself: you can buy a broad-market ETF expecting to make similar returns over the long-term of 8-10%. But why not try to improve this level of return by picking stocks with better characteristics than the market (either cheaper or with high growth potential or, ideally, both)? This is where the problem starts.
The root of the problem is that stocks, on average, underperform the index itself. This is the gist of the issue, which is not widely discussed. So I will repeat the message – an average stock in an index delivers results that are on average below the index.
While this sounds paradoxical, almost absurdly, it, nevertheless, has an important message – returns from equity investments are generally inflated, and anyone picking individual stocks rather than a broad market index has odds stacked against him. In other words, a person is facing lower returns than 8-10% annual stock market gains that are often considered as average market returns over the long term.
Here are the key facts behind this statement:
- From 31 Dec 1997 until 31 Dec 2017, half of the stocks in the S&P index delivered results in the range of -100% to +50% (some went bust), while the average change in the S&P index was +228% over the same period. The median return of a stock (measured when all stocks are ranked by performance and the one in the middle is selected) is lower than the average return of all stocks weighted by their market cap (the index). Using math terms, one can say that stock returns are positively skewed; in other words, few stocks deliver disproportionately strong results pushing the overall index higher, while most stocks do not do anything so exciting. From a probability point of view, it is very unlikely that you could select those 20 stocks out of 500 (4%) that have delivered over 1,000% returns in over 20 years.
Distribution of stock returns in the S&P 500 from 31/12/1997 to 31/12/2017
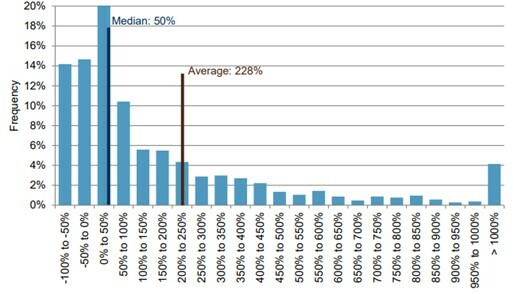
Source: Index Investment Strategy by Anu Ganti and Craig Lazzara, S&P Global
- Returns of stock investors are typically lower than stock market returns: the return differential is 1.3 per cent for the NYSE/AMEX market over 1926-2002, 5.3 per cent for Nasdaq over 1973-2002, and an average of 1.5 per cent for 19 major international stock markets over 1973 to 2004, all highly statistically significant[1].
- A tiny group of stocks account for a disproportionate share of overall returns. All wealth generated by US stocks since 1926 (26,168 stocks) was generated by just 4% of those stocks (1,092). The remaining 96% of stocks generated returns that only matched T-bills performance. During the 1926-2019 period, 57.8% of US stocks (15,132 out of 26,168) generated returns below cash yield (measured by T-bills). Just five firms (Apple, Microsoft, Exxon Mobil, Amazon and Alphabet) have contributed 10.4% to the overall wealth creation in that period. Top 50 firms account for 41% of all wealth creation. Put differently, 41% of wealth has come from just 0.2% of companies (50 out of 26,168)[2].
- The single most common outcome for stocks has been a 100% loss (companies went bust). In comparison, just 43% of common stocks have a buy-and-hold return (inclusive of reinvested dividends) that exceeds the return to holding one-month Treasury Bills over the matched horizon. The median life of a stock is only seven and half years (although some of this shortness is due to M&A activity rather than bankruptcies)[3].
- Only 31% and 26% of individual stocks have outperformed the value-weighted and equal-weighted indices, respectively (during the 1926-2016 period). The median return of a stock over a lifetime has been a negative -2.3%, even though an average (mean) return for a stock in the same group and period (1926-2016) has been a positive 187%. The mean return of all stocks on an annual basis is 14.7%, while the median annual return is only 5.2% during the 1926-2016 period[4].
All those data points suggest that the distribution of individual stock returns is not normal and is positively skewed. In less technical terms, a small number of stocks (e.g. Amazon, Apple, Microsoft using the latest examples) make disproportionately large returns pulling the group's overall results higher.
The fact that individual stocks deliver results that are, on average, worse than the overall index also means that the performance of the index inflates the performance of the broader equity market due to survivorship bias. The problem is that the results do not consider the results of those stocks that did not make it (went bust) as the index keeps being regularly updated. In general, it is easier to track the performance of things (as well as individuals or businesses) that have survived over the long term and, thus, missing those things that have disappeared over time.
This data on actual performance can also be proved with some basic math examples. To my surprise, I came across this example in Rory Sutherland’s book ‘Alchemy: The Surprising Power of Ideas That Don't Make Sense’. Consider a game in which you bet $100, and there are only two outcomes: win or lose. If you win, you get $55 and, otherwise, you lose $45. Is this game worth playing? The answer, surprisingly, is not quite what you think.
The standard way to look at this situation would be to work out the expected mean result, leading to $105 ($155 x 50% + $55 x 50%). In other words, you would likely end up with $105 gaining $5 compared to your original position of $100. But this only works for many people playing this game (each betting $100) or the same person making a $100 bet many times.
But consider a situation when a person makes continuous bets with the exact probabilities and gains and losses (relative to the bet). So, there is a 50/50 chance to either earn 55% on your bet (investment) or lose 45% of it. The simple calculation suggests that this is the game worth playing as, on average, you can be $5 better off (you can either have $155 if you win, or just $55 if you lose, but given that chances are 50/50 - the weighted average probability is that you end up with $105 - $5 more than when before playing the game).
However, the truth is that if you keep betting all the capital, you are more likely to end up poorer than richer despite higher gains than losses. This paradoxically sounding statement becomes easier to understand looking at the following example.
A person making his first bet of $100 is facing two scenarios. He can end up with $155 if he wins (55% return on $100 wager) or $55 if he loses (45% loss on $100 bet) after the first round. Now, the trick is in the second round, after which the person can be lucky and end up with $240.25 in his pocket or with less than $100 in three other outcomes! So, in 3 out of 4 scenarios, the person ends up with less money than before playing this game. In the worst case of two straight losses, the person would have just $30.25 left, while in two other scenarios (a win and a loss or a loss and then a win), there would be $85.25 in his account - less than the original $100.
After round 3, there is the same number of scenarios when the person has more money as when he ends up with less than $100. After round 4, the share of scenarios with more than $100 drops to 31%, then it recovers a little after round 5 to 47%, but still remains below 50%.
In other words, the chances of getting rich in such a game where odds in each round are stacked in your favour – are less than 50% if you play this game long enough. The chart below shows the average net worth of a player after each round, the net worth of a median player, and the total share of outcomes when the net worth is higher than initially.
Average net worth after playing each round of game and share of winning outcomes
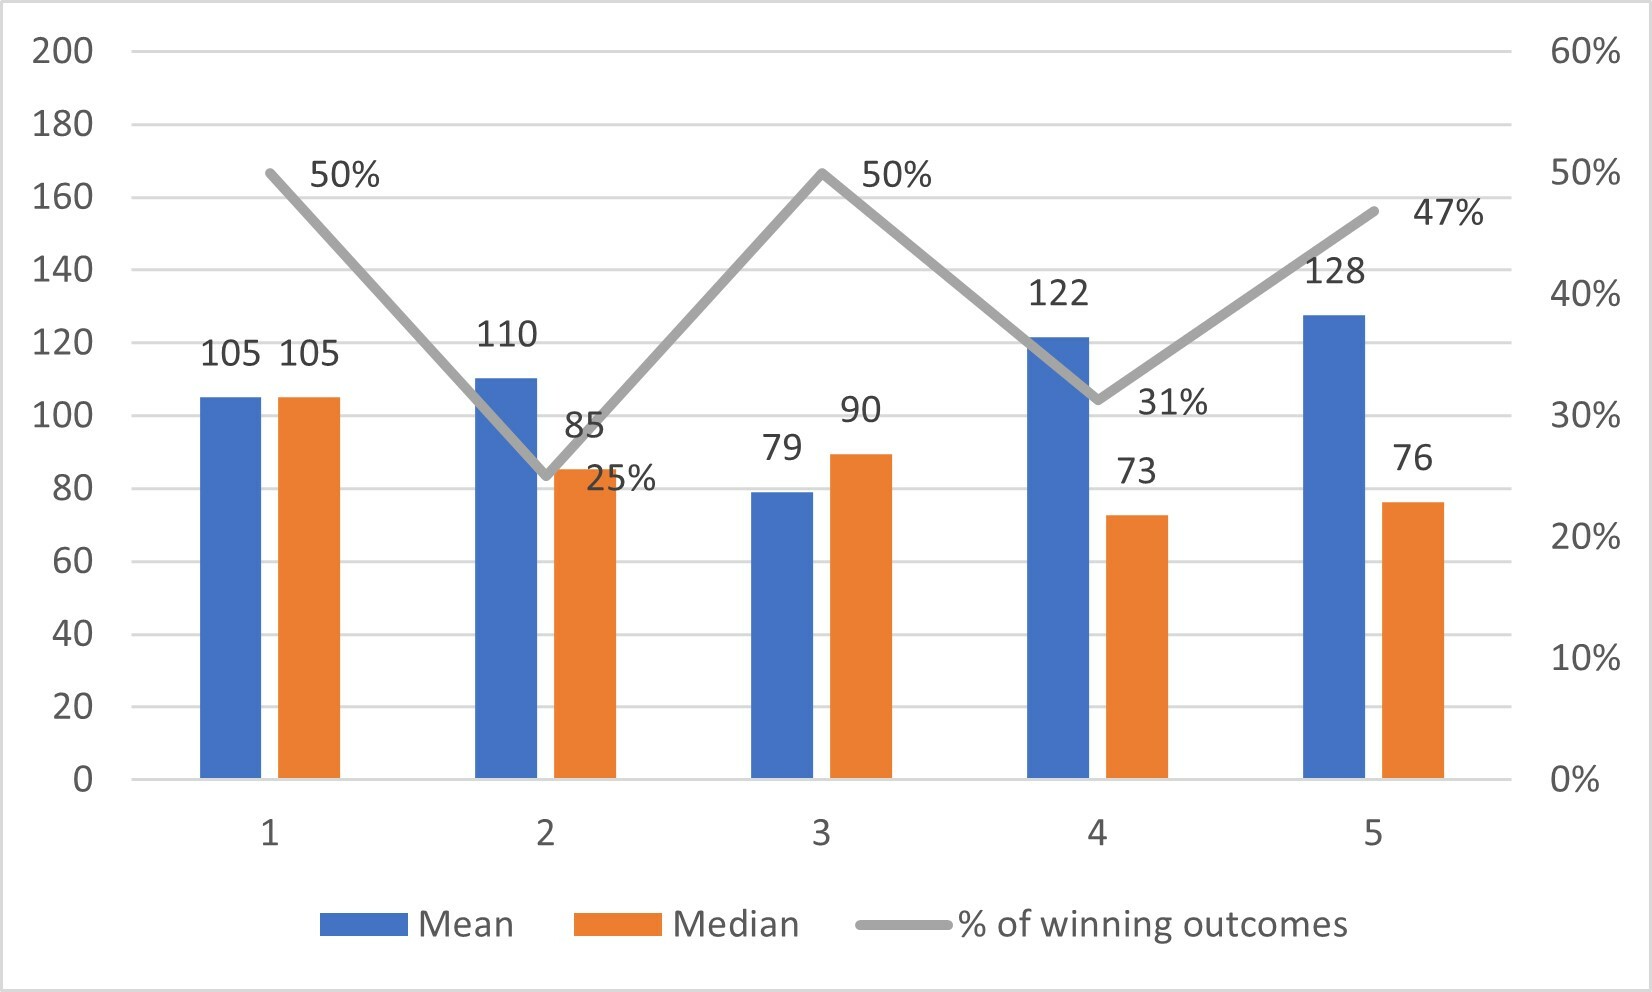
Source: Hidden Value Gems
The sad truth is that such a game makes players richer on average, but at the same time, makes a typical player poorer. This is when the median drops while the average keeps rising. To make this look more obvious, consider yourself watching your favourite sports game at a stadium when Jeff Bezos walks in to watch the same game. The average wealth of people at the stadium would rise multiple times. If it were $300k before Bezos and assuming Bezos is worth $100 billion, then the average wealth of a person would increase 17.7x to $5.3 million.
Of course, no one will see their actual wealth change by a penny with or without Bezos at the stadium. This is similar to the game I discussed above and is, in a way, to the stock market too. In the game above, the collective net worth of players would keep rising because the minority would be getting extremely rich while the majority would be losing money. A broad stock market index keeps growing over the long term, but within it, just a select few super investors are getting extremely rich. At the same time, the majority generate lower returns than the index.
An important reference to mathematics
More sophisticated readers may notice that we deal with different types of average values. On the one hand, there are mean and median values (average value of a group and a value of an average member of that group). But, on the other hand, we also deal here with arithmetic and geometric means. Geometric mean (measured as the product of values of all group members to the power of 1/number of members) is much less often used. Still, it is more relevant in measuring the performance of investments as they are compounded.
Some people make a mistake when trying to understand a multi-year return using an arithmetic mean instead of a geometric one. Consider the following example. You buy a stock for $100, selling it in 3 years at $130. You intuitively think that your annual return was 10% ((130-100)/3). Your actual yearly return was 9.1% if you calculate it using the geometric mean.
To illustrate how two types of averages can impact your investment decisions, I would like to use the following example, which I borrowed from an exciting book on probabilities and information (Fortune’s Formula by William Poundstone). Imagine you can choose to play at one of the following three roulettes (see the picture below). Which one would you choose?
Chose the roulette that offers the best-expected payoff
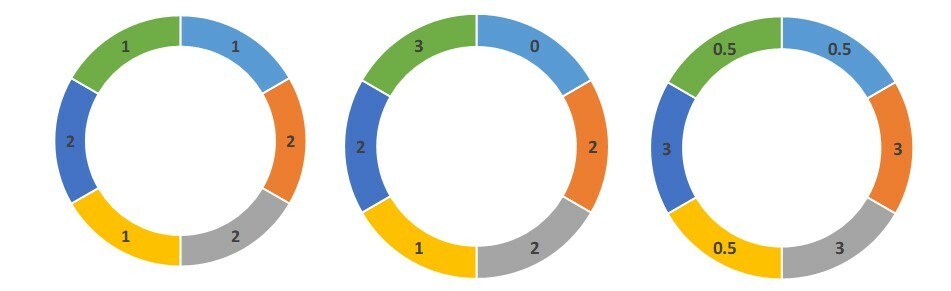
Source: ‘Fortune’s formula’ by William Poundstone (2005)
The standard approach would be to pick the roulette with the highest expected mean payoff calculated as the prize in each outcome times the probability of each outcome occurring. Such an approach would point to the third roulette (the one on the right) as its average payoff is $1.75, higher than the payoff of the first ($1.50) and second roulette ($1.67).
However, using a geometric mean, the best roulette would be the first roulette (the one on the left) which offers a $1.41 payoff compared to $0 provided by the second and $1.22 by the third roulette. Geometric mean would resemble a typical investment process of a fully invested portfolio when you exit one stock and reinvest proceeds into a new stock. The amount you invest in the new stock depends on the performance of your previous stock, which also impacts your gain in absolute terms from the new stock, which would then affect your future performance and so on.
It is also interesting that any game or process in which you face a possibility of a total loss is not worth playing at all if you apply the geometric mean method. The absolute size of outcomes is the only factor that matters, not the probabilities. Such an approach would always reject stocks that have the possibility of going to zero (bankruptcy), like highly leveraged businesses in a cyclical sector facing an extended downward phase of the cycle.
This way of selecting stocks reminds me of Joel Greenblatt's method, which he described on one of the podcasts in 2020[5]. In that interview, Greenblatt made an interesting point that when deciding on weights for individual stocks in a portfolio, most investors look for potential upside and assign the highest weight to those securities that offer the best returns. On the other hand, he invested the most money into stocks with the lowest downside.
This approach (of maximising geometric mean of return) is more widely known as the Kelly criterion, developed in the 1950s by John Kelly, a scientist working for Bell Labs at that time, and was one of the core principles for a famous investor Ed Thorp. Kelly criterion is a formula for deciding on the size of the bet using an edge and odds as two key inputs.
I plan to cover the issue of the right size for individual stocks in a separate post.
To finish my point on odds stacked against a stock picker, I thought I should refer to a recent interview of Charlie Munger at Caltech University[6]. During that interview, Munger compared the evolution of various businesses to biological processes. In biology, all the individuals die, so do all the species. It is just a question of time. Munger went further to say that this also happens in the economy too. ‘All the things that were great when I was young have receded enormously. New things come up, and some of them have started to die. That is what the long-term investment climate is. Look at what has died – department stores, newspapers. If technology hadn’t changed, newspapers would still be great businesses. U.S. Steel, John D. Rockefeller’s Standard Oil is a pale shadow of its former self. It’s just like biology. They have their time, and then they get clobbered’.
So, the default assumption for anyone looking to pick individual stocks is that the odds are stacked against him. 57% of US stocks delivered returns below T-bills, according to the study by Hendrik Bessembinder from the Arizona State University, while the most common outcome for stocks is a total loss.
The main message of this note is that investing is much more complex than it appears to be, especially when advisers tell you that stocks, on average, produce 8-10% return a year. In addition to the statistical results which I have provided, there are other pitfalls such as mistakes in investment analysis, human’s psychology, changes in personal circumstances that may force you to sell stocks at the worst moment (e.g. during the crisis when you lose your job and have to sell stocks to cover your day-to-day expenses).
There are three main methods of investing that I consider appropriate based on the above facts. First, a broad market index that can be bought via a low-cost ETF. It may sound dull or too ordinary considering the surge of passive investing. However, it will likely produce better results than a portfolio selected by an individual. My issue with ETFs is that they force you to take macro views – if you know that you have exposure to the broad ‘market’ rather than individual businesses, you inevitably start focusing on factors that affect the broader market (including interest rates, GDP outlook, political developments etc.). Not only it is impossible to get an edge in this area, but this also increases the risk of you trying to time the market by selling out of the market when you think the outlook is getting worse and buying on positive changes. A solution could be a disciplined, rule-based approach when you allocate the same amount of money to purchasing ETF every month. Still, buying something without regard to valuation is a concern for me. Knowing that you can indirectly buy more of something that just got more expensive (as companies whose share price outpaces earnings growth would enjoy a higher share in the index leading to additional demand from passive investors) is a serious concern for me.
The second approach is buying high-quality companies with strong competitive advantages (‘moats’), enormous potential for expanding their sales, strong management with strong alignment of interests through direct ownership of shares in the company (preferably, companies led by founders). And make sure you don’t overpay for them. William Poundstone, the author of the book ‘Fortune’s Formula’ which I referred to previously, has written another exciting book - ‘How to predict everything’. He described a few methods used to forecast future events, including Lindsy’s law and the Copernican method. The idea of Lindsy’s law is that the future life expectancy of non-material things (e.g. books) is proportional to their current age. If applied to stocks, this would mean that companies with longer histories are more likely to remain in business over the long term.
Besides, if we also apply geometric mean in our analysis (Kelly criterion), we would favour companies that avoid heavy losses as stable return compounds to a better result than more volatile earnings over time.
Combining both ideas, we would likely narrow our stock selection to well-established brands with high margins and steady earnings growth – similar to Warren Buffett’s portfolio. The critical areas of focus in such an approach are the price you pay for such businesses and the risks of disrupting the traditional business model (e.g. an established retail operator like Macy’s maybe find it much harder to compete in the age of e-commerce).
Finally, the third approach I see is to pick highly discounted stocks and exploit the value disconnect by being more patient than the market and avoiding outright losers (companies that go out of business). Hence, particular focus needs to be paid to its leverage and the product it offers (important to avoid Kodaks, Nokias and Blackberries). Such an approach requires maintaining relatively high diversification (30-50 stocks) to reduce the volatility and risks of individual companies.
An ideal investment would be a company on the verge of transformation whose stock could be purchased cheaply because the market has become disappointed by past performance and then enjoy expanding valuation multiple as investors get more reassured by improving performance and the benefit of rising earnings. The combined effect of rising PE multiple and earnings growth could generate far superior returns than what could be earned in the broader market over the medium term.
I hope there was something useful for you in this note. I would appreciate your feedback, any comments or ideas – please feel free to send them at ideas@HiddenValueGems.com.
Stay tuned as I plan to discuss the tools for selecting the winners and share the real-time experience of investing my own money in future notes. If you want to stay up to date – you can subscribe here.
[1] What are stock investors’ actual historical returns? Evidence from dollar-weighted returns, by Ilia Dichev, Ross School of Business at the University of Michigan).
[2] Wealth Creation in the US Public Stock Markets 1926 to 2019, by Hendrik Bessembinder, Arizona State University.
[3] Do Stocks Outperform Treasury Bills? By Hendrik Bessembinder, Arizona State University.
[4] Do Stocks Outperform Treasury Bills? By Hendrik Bessembinder, Arizona State University.
[5] https://capitalallocatorspodcast.com/2020/11/22/greenblatt/
[6] See this link for the full interview with Charlie Munger - https://www.youtube.com/watch?v=WaDU1J91hY8.