


6 August 2023
In today’s post, I discuss a few paradoxes I have discovered over time. At the end, I provide an example of the largest stock in my portfolio and explain how these concepts apply to it. Unfortunately, I have never learnt them at university or while studying for the CFA exams.
Solutions to those riddles provide the key to building the best stock portfolio. They are based on such simple maths concepts that many of us just ignore.
When you look for a car to win in a race, do you look for the fastest car? Do you look for the stock with the highest upside to add to your portfolio? When gambling, do you go for the bet with the highest expected value? As unexpected as it may sound, “Absolutely, yes!” is the wrong answer to all these questions.
The young people's advantage
Before diving into stock selection, let me highlight one fundamental point. It is crucial to be aware of it and follow it before researching a stock, just like a professional tennis player puts on her training shoes before learning the secret technique of a serve.
It is even more crucial for investors since many people don’t fully realise the paradox.
Let me ask you: who would have more money upon retirement, John or Jessica? Here are some further details about them: both the same amount a year ($2,000) and invest at a 10% annual return. Both want to retire at 65 (old school, I know). But John saves over 40 years, while Jessica only for 7.
It is damn easy, of course, John, right?
Well, but what if I told you that Jessica was saving from the age of 19 and John from the age of 26? “Probably doesn’t matter”, you would say. In the end, John makes 40 (!) contributions, while Jessica makes only 7. As bizarre as it may be, but it is Jessica who would end up with more money at retirement.
If you read Joel Greenblatt’s latest book, Common Sense: The Investor’s Guide to Equality, Opportunity, and Growth, you would be familiar with this example. It still strikes me as somewhat of a puzzle how one person saving $80,000 ends up with less wealth compared to someone who just saved $14,000, and both people invested at the same annual rate of return.
A short way to prove this mathematically is to estimate the sum of all numbers in a geometric progression. The formula to do it is as follows:
A = X1 * (qn-1) / (q-1), where
If my calculations are correct, Jessica would end up with $20,872 by the age of 26. I have assumed that she allocates money on her birthday so that it works from the beginning of each year. From 26, when she stops saving, that amount would grow to $944,641 by the time she is 65 years old.
John, on the other hand, saves for 40 years in a row, much longer than Jessica, but he ends up with just $885,185 savings (like in the case of Jessica, I assumed John saved at the start of each year).
The first lesson here is that the same return on an asset will generate more wealth for a person who starts saving earlier, not necessarily saving more money. So try to start saving as early as possible.
It is even more crucial for investors since many people don’t fully realise the paradox.
Let me ask you: who would have more money upon retirement, John or Jessica? Here are some further details about them: both the same amount a year ($2,000) and invest at a 10% annual return. Both want to retire at 65 (old school, I know). But John saves over 40 years, while Jessica only for 7.
It is damn easy, of course, John, right?
Well, but what if I told you that Jessica was saving from the age of 19 and John from the age of 26? “Probably doesn’t matter”, you would say. In the end, John makes 40 (!) contributions, while Jessica makes only 7. As bizarre as it may be, but it is Jessica who would end up with more money at retirement.
If you read Joel Greenblatt’s latest book, Common Sense: The Investor’s Guide to Equality, Opportunity, and Growth, you would be familiar with this example. It still strikes me as somewhat of a puzzle how one person saving $80,000 ends up with less wealth compared to someone who just saved $14,000, and both people invested at the same annual rate of return.
A short way to prove this mathematically is to estimate the sum of all numbers in a geometric progression. The formula to do it is as follows:
A = X1 * (qn-1) / (q-1), where
- X1 is the first number in the progression ($2,000 in our case)
- q is the coefficient of change (1.1 or 110% in our case)
- n is the number of members in the progression (40 for John and 7 for Jessica).
If my calculations are correct, Jessica would end up with $20,872 by the age of 26. I have assumed that she allocates money on her birthday so that it works from the beginning of each year. From 26, when she stops saving, that amount would grow to $944,641 by the time she is 65 years old.
John, on the other hand, saves for 40 years in a row, much longer than Jessica, but he ends up with just $885,185 savings (like in the case of Jessica, I assumed John saved at the start of each year).
The first lesson here is that the same return on an asset will generate more wealth for a person who starts saving earlier, not necessarily saving more money. So try to start saving as early as possible.
Chasing dividends or growth?
There are many ways to generate a 10% return. This could be a high-yield bond, a company with a combined buyback and dividend yield of 10% or a firm with a 10% return on equity that keeps all the profits in the business.
What is the preferred way to allocate profits from a shareholder's perspective?
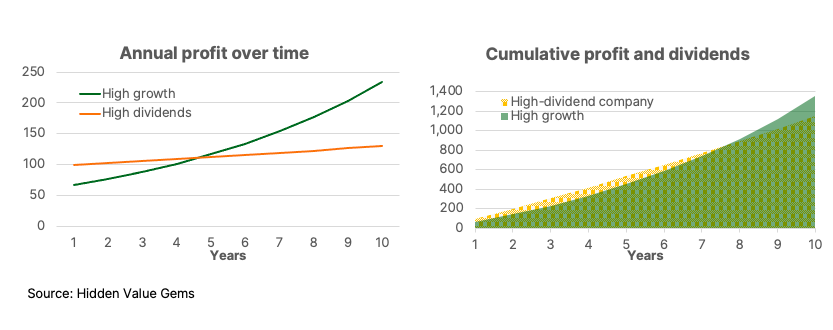
Imagine John decided to invest in a company that generated a 10% return on capital but shared 70% of its profits via dividends and invested the remaining 30% back in the business (at 10% returns). Suppose the dividend received every year is kept in a savings account at a 2% rate.
Let’s also assume that Jessica prefers a company with smaller profits and no dividends but which grows at 15% a year.
This is how the earnings trajectory of the two companies would look over ten years.
What is the preferred way to allocate profits from a shareholder's perspective?
Imagine John decided to invest in a company that generated a 10% return on capital but shared 70% of its profits via dividends and invested the remaining 30% back in the business (at 10% returns). Suppose the dividend received every year is kept in a savings account at a 2% rate.
Let’s also assume that Jessica prefers a company with smaller profits and no dividends but which grows at 15% a year.
This is how the earnings trajectory of the two companies would look over ten years.
You may wonder what prices each of our investors pays for those stocks.
Let’s suppose that John pays 10x for a high-dividend stock with $100 annual profits. The stock continues to trade at 10x over the following 10 years. In this case, by the end of the first year, his initial investment of $1,000 would grow to $1,070 ($100 profit multiplied by 10 plus $70 dividend). In year 2, the total value of his investment would be worth $1,171 ($103 profit times 10 plus $70 dividends for Year 2 plus $71.4 dividend from Year 1, which increased by 2%).
By year 10, the value would grow to $2,071, with cumulative dividends amounting to $766.5 and the value of the stock rising to $1,304.8 ($130.48 net income multiplied by 10).
Now, let’s see what happens to the value of a zero-dividend stock picked by Jessica.
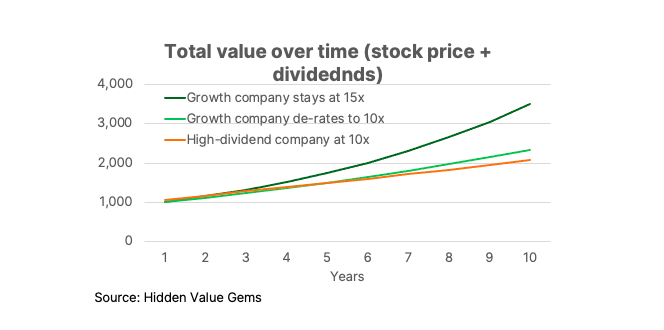
Suppose she paid a higher PE multiple at the beginning - 15x (compared to 10x paid by John) for a stock with $67 in profits, making the same initial investment as John ($1,000).
Let’s also assume that for whatever reasons, by the end of the ten-year period, the growth stock de-rates to 10x earnings. Nevertheless, growing at 10% a year, the second company would generate $234.5 annual profits in Year 10, which leads to a price of $2,345. This is more than $2,071 that John would have over the same time.
Let’s suppose that John pays 10x for a high-dividend stock with $100 annual profits. The stock continues to trade at 10x over the following 10 years. In this case, by the end of the first year, his initial investment of $1,000 would grow to $1,070 ($100 profit multiplied by 10 plus $70 dividend). In year 2, the total value of his investment would be worth $1,171 ($103 profit times 10 plus $70 dividends for Year 2 plus $71.4 dividend from Year 1, which increased by 2%).
By year 10, the value would grow to $2,071, with cumulative dividends amounting to $766.5 and the value of the stock rising to $1,304.8 ($130.48 net income multiplied by 10).
Now, let’s see what happens to the value of a zero-dividend stock picked by Jessica.
Suppose she paid a higher PE multiple at the beginning - 15x (compared to 10x paid by John) for a stock with $67 in profits, making the same initial investment as John ($1,000).
Let’s also assume that for whatever reasons, by the end of the ten-year period, the growth stock de-rates to 10x earnings. Nevertheless, growing at 10% a year, the second company would generate $234.5 annual profits in Year 10, which leads to a price of $2,345. This is more than $2,071 that John would have over the same time.
I am not saying you should always choose growth stocks. The dividend yield is a good indicator of value and should be taken into account. But the critical driver of returns over the long term is the incremental return on capital and the amount of profits that is reinvested back into the business. A lot of it depends on the management team and its capital allocation skills.
But before you start looking for companies with the highest rate of return, let me make one unexpected claim. There is something even more important than that. This is not timing or regulatory environment, it is not even industry competition.
In one of my first posts, I discussed the difference between arithmetic and geometric averages. Before you stop reading, as it sounds like a boring school lesson, let me tell you that, in my view, this is one of the most underappreciated concepts and the biggest secret in Buffett’s stock-picking skills.
Is this Buffett’s biggest secret?
Forget John and Jessica for a second. Let’s focus on you. Imagine you want to put your savings to work and consider which fund to choose. It could also be a choice between two companies.
Over a ten-year period, Company A delivers faster growth than Company B in all but one year. Both companies have an (arithmetic) average growth rate of 7%.
Here is the table with data for each period.
Over a ten-year period, Company A delivers faster growth than Company B in all but one year. Both companies have an (arithmetic) average growth rate of 7%.
Here is the table with data for each period.
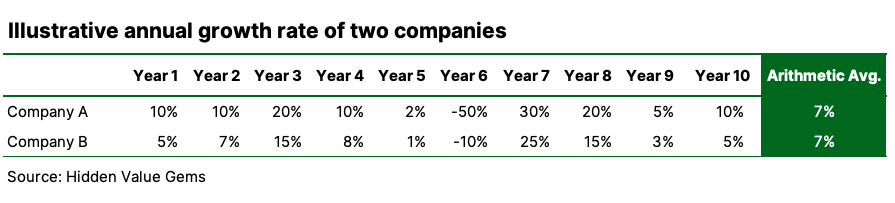
Given that the rates are the same, but Company A (or Fund A) almost always delivers better results, it looks to be an obvious choice.
Well, wrong. Company B will have higher profits in Year 10 than Company A. Same with an investment fund. The fund which underperforms in 9 out of 10 years will have a higher NAV in ten years than the one which has been ahead in 9 out of 10 years.
How come?
The answer lies in the difference between geometric mean and arithmetic mean. The geometric mean is more sensitive to big changes in just one year because it multiplies the data in each year (while the arithmetic average adds them up). So if in one year a company wipes out all of its profits and capital, its value stays zero for the remaining period.
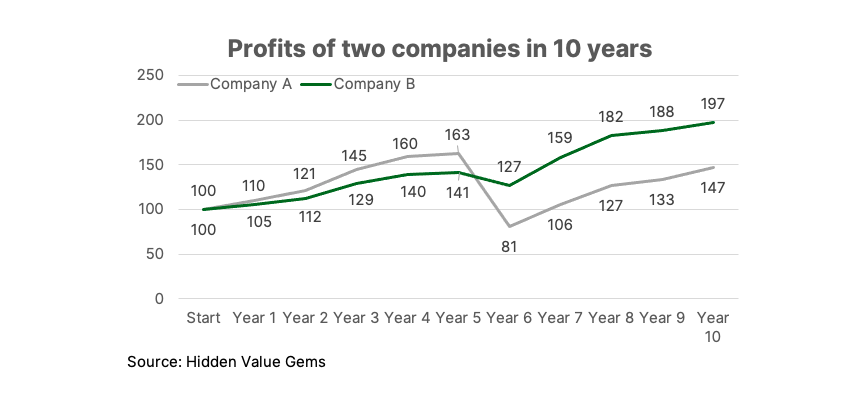
The average 10-year growth rate of Company A is only 2% if calculated using a geometric average method (which is the same as compound annual growth rate, or CAGR). Company B has achieved 4% compound growth, and this is the source of its ultimate outperformance.
It is hard to make it a successful asset management business if you underperform your peers for nine out of ten years (even if you come ahead in the end). But as an individual investor who can afford to think longer term, there is little point in benchmarking your portfolio against the market at regular intervals.
The prime lesson here is to avoid heavy losses even over a short period of time. The quality of stocks in your portfolio matters much more than relative performance in a few years.
The final paradox: is a winning bet always winning?
This is my final question for today. Congratulations if you have reached this far. As promised, at the end, I will explain how my biggest portfolio position relates to all the riddles I am discussing today.
You are offered to play a coin flip game which pays 55% if you correctly guess on what side a coin lands (plus you get the original money back). If you are wrong, you lose 45%. So if you bet $100 and you are right, you get $155. If you are wrong, you end up with $55 in your pocket. Is it a good game to play?
Anyone familiar with the concept of expected value will answer “Yes”. But this only applies to situations when you can make a lot of $100 bets or when many people make this bet.
But if $100 is all you can bet, then playing this game will most likely make you poorer! If it sounds crazy, just consider this example of playing the game over two rounds. There are four potential combinations of how the coin lands. The probability of each of the four scenarios is the same (i.e. 25%).
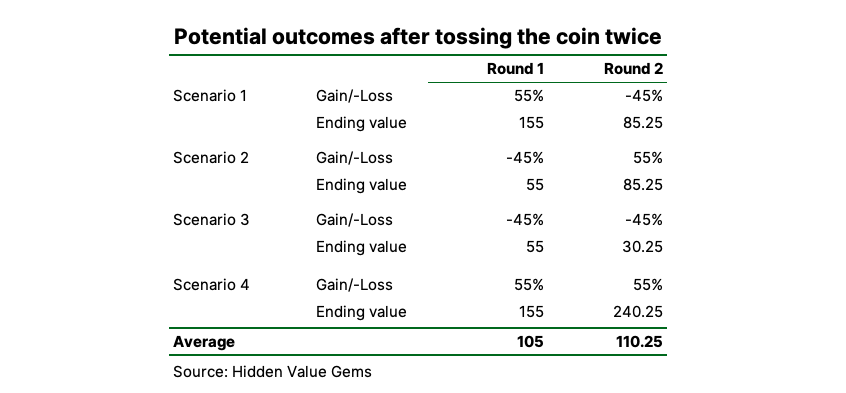
If you are right both times, then your $100 grows to $240.25. But in all other cases, when you are right just once or wrong both times, your bet drops to either $85.25 or $30.25! In the latter case, you would need to correctly predict the coin flip for the following three times in a row to make your money back. This is one out of eight probability - pretty low.
This effect can explain why a minority of stocks deliver disproportionately high returns while the majority of stocks underperform the average index. It can also explain why out of millions of people investing, a minority gets super rich while the majority increase their net worth only moderately.
The same lesson of avoiding heavy losses applies here. Think about downside risks before you think about the upside. Another lesson is to size your bets so that you can bet the same amount over as long as possible. The easiest option is to have a regular (monthly) allocation to stocks so that results in one particular period don't affect your overall portfolio.
Conclusions
- Starting investing early matters more than how much you invest over your lifetime.
- Focus on stocks with high reinvestment rates and high returns on capital if you plan to hold them over the long term.
- Avoid companies that may face huge losses even if it happens 10% of the time.
- Relative performance in a single year or even several years means very little. The quality of stocks in your portfolio matters much more than relative performance in a few years.
- It is not the expected value of your investment that matters but your ability to keep investing after taking losses.
- Think about downside risks before you think about the upside.
These points help to identify companies to avoid. These are highly-levered businesses or companies with quickly deteriorating market positions, especially if their product is becoming obsolete. Companies with management teams that have historically undertaken large value-destructive M&A deals are also in that category.
At the same time, companies with conservative balance sheets, strong market positions and operating in sectors with little change look to be a much better option.
This brings me to my biggest position - Berkshire Hathaway. Its two largest operating businesses are utilities and railroads, which you can safely assume will be operating for many decades ahead (definitely longer than a typical AI start-up launched today). Its insurance businesses have unique characteristics, especially in the reinsurance segment. The stock portfolio comprises well-known brands with solid margins and little debt (although Apple's overall size and current valuations raise some questions). In addition to that, Berkshire sits on over $140bn cash position. Finally, the business is run by Warren Buffett, who has 99% of his net worth in the company and has a proven track record of the best capital allocation skills for 70 years.
I see very few risks in owning the business. It has historically compounded capital at 20%, but the rate has declined recently, primarily due to size. Low-interest rates and a generally high valuation environment prevented Berkshire from more actively deploying capital. All these were additional factors that kept returns lower.
I am confident that Berkshire should be able to produce 10% returns over many years in the future with an additional 3-4% benefit from the insurance float. Its ability to do it without significant interruptions is another crucial factor.
If you found it useful, consider subscribing to my Newsletter to receive the next article. As a young author, it would also help me tremendously if you could share this article with others. Thank you for your time and support!