


30 July 2023
The UK stock market has not been popular recently. Many view it as a mix of natural resources and banks, the two sectors which have historically generated low returns and never traded at consistently high valuation multiples.
Yet, such a view oversimplifies the situation and misses dozens of excellent businesses that have generated strong growth and value for their shareholders. Besides weak sentiment, I am encouraged to see declining research activity post-Mifid, with many small and mid-sized companies being covered by one or two brokers at best.
For a contrarian investor, the UK could be a promising hunting ground.
So this month’s edition of the Monthly Stock Idea Lab will be on the eight UK companies that caught my eye. I have even opened a small position in one of them (I will disclose it in the relevant section below). Let’s dive in.
Watches of Switzerland
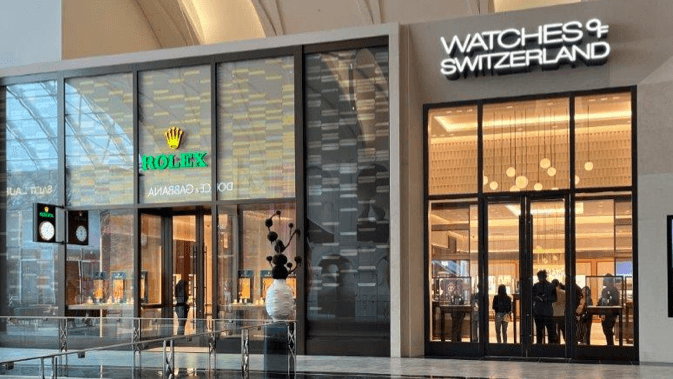
Source: Watches of Switzerland Investor Presentation
Ticker: WOSG LN
Price: 720p
Mkt Cap: £1,7bn
EV: £1,7bn
While I don’t like luxury goods myself, I think being in the business of producing such goods can be pretty exhilarating. High prices and limited availability increase customer demand and willingness to pay. Pricing power is almost guaranteed. Capital requirements are small. Age strengthens brand attractiveness, unlike in many other sectors where products must remain fresh due to fast technological improvements.
Retail, on the other hand, is a highly competitive industry with high fixed costs and, consequently, slim and volatile profit margins. But a retail shop selling luxury goods has more attributes of the latter, in my view.
Keeping customers happy and maintaining the feeling of exclusivity is crucial for luxury brands. So if a new retailer offers a better deal to a brand (selling its goods with a lower markup), he will likely be rejected. The risk of something going wrong with this new retailer far outweighs the marginal financial gains he offers.
This is why Watches of Switzerland Group (WOSG) looks quite interesting to me.
The company was listed on the LSE in June 2014. It was formed in 2005 through a merger of three luxury retail chains: Mappin & Webb, Goldsmiths and Watches of Switzerland. Each of them has been in business for over 100 years. Mappin & Webb has undertaken commissions for and sold jewellery to an extensive list of illustrious clients since its inception in 1775 in Sheffield, UK. It has been a silversmith to all U.K. sovereigns since 1897 and has served five monarchs over a continuous period of 115 years.
Goldsmiths was founded in Newcastle, United Kingdom as a jeweller in 1778 and became the first authorised retailer of Rolex watches in the United Kingdom in 1919.
Watches of Switzerland was formed in the United Kingdom as a specialist watch retailer in 1924 and has been selling luxury watches ever since.
Since FY-14, WOSG has increased its revenue at a CAGR of 18%. One of the key drivers was the entry into the US market in 2017. The share of US sales has increased from 10% in 2017 to 42% in FY-23. Another factor has been the refurbishment of existing stores in the UK with a particular focus on customer experience.
Other luxury goods (non-watches) account for 8% of revenue (FY-23) and services for 6%. The share of those two segments has been marginally declining in the total revenue mix.
WOSG is the largest retailer of luxury watches in the UK and second-largest in the US.
The sector has relatively high barriers to entry since establishing relationships with luxury watch brands takes much time. Besides, large-scale operators like WOSG have the natural advantage of having a wider choice and availability of brands and being able to invest more in their showrooms and employees.
The company runs a portfolio of 146 stores in the UK and has a growing presence in the US, with 47 stores and 6 in Europe (as of 30 April 2023). It is the largest retailer of luxury goods in the UK with a market share of about 35%, which is more than the combined market share of independent stores (25%), other multi-store groups (18%), mono-brands (14%), and department stores such as Selfridges and Harrod’s (8%).
The US market remains highly fragmented, and as a result, the luxury watch category is much smaller compared to other categories. Despite the US being larger than the UK in population (4.9x bigger) and richer per capita (about 30%), its luxury watch market is only 1.9x bigger than the UK. The high share of small retailers and existing grey market have historically kept that segment below its potential.
Strong demand and a constant shortage of certain luxury watch brands results in customers being put on waiting lists. WOSG sells 20-30% of landmark watches like Rolex, Patek Philippe and Audemars Piguet to its customers on those waiting lists.
Besides gaining scale, the company has materially improved its operating margin from less than 4% in FY-16 to 10.7% last year, with ROIC reaching 27.9% (based on the company’s calculations).
WOSG had a net cash of £16mn at the end of April 2023 compared to a net debt of £14mn a year before. The company does not pay dividends at this stage as it continues to expand its business.
The company was owned by a private equity firm, Apollo, before being listed in 2019. Currently, it doesn’t have any large non-financial investors.
Like the SDI Group, management has relatively low ownership of the business, mainly acquired through share bonuses rather than open-market transactions. The company’s CEO, Brian Duffy, has a 3.2% interest.
I opened a small position in the company (just under 1% of the total portfolio), which may increase once I do more research.
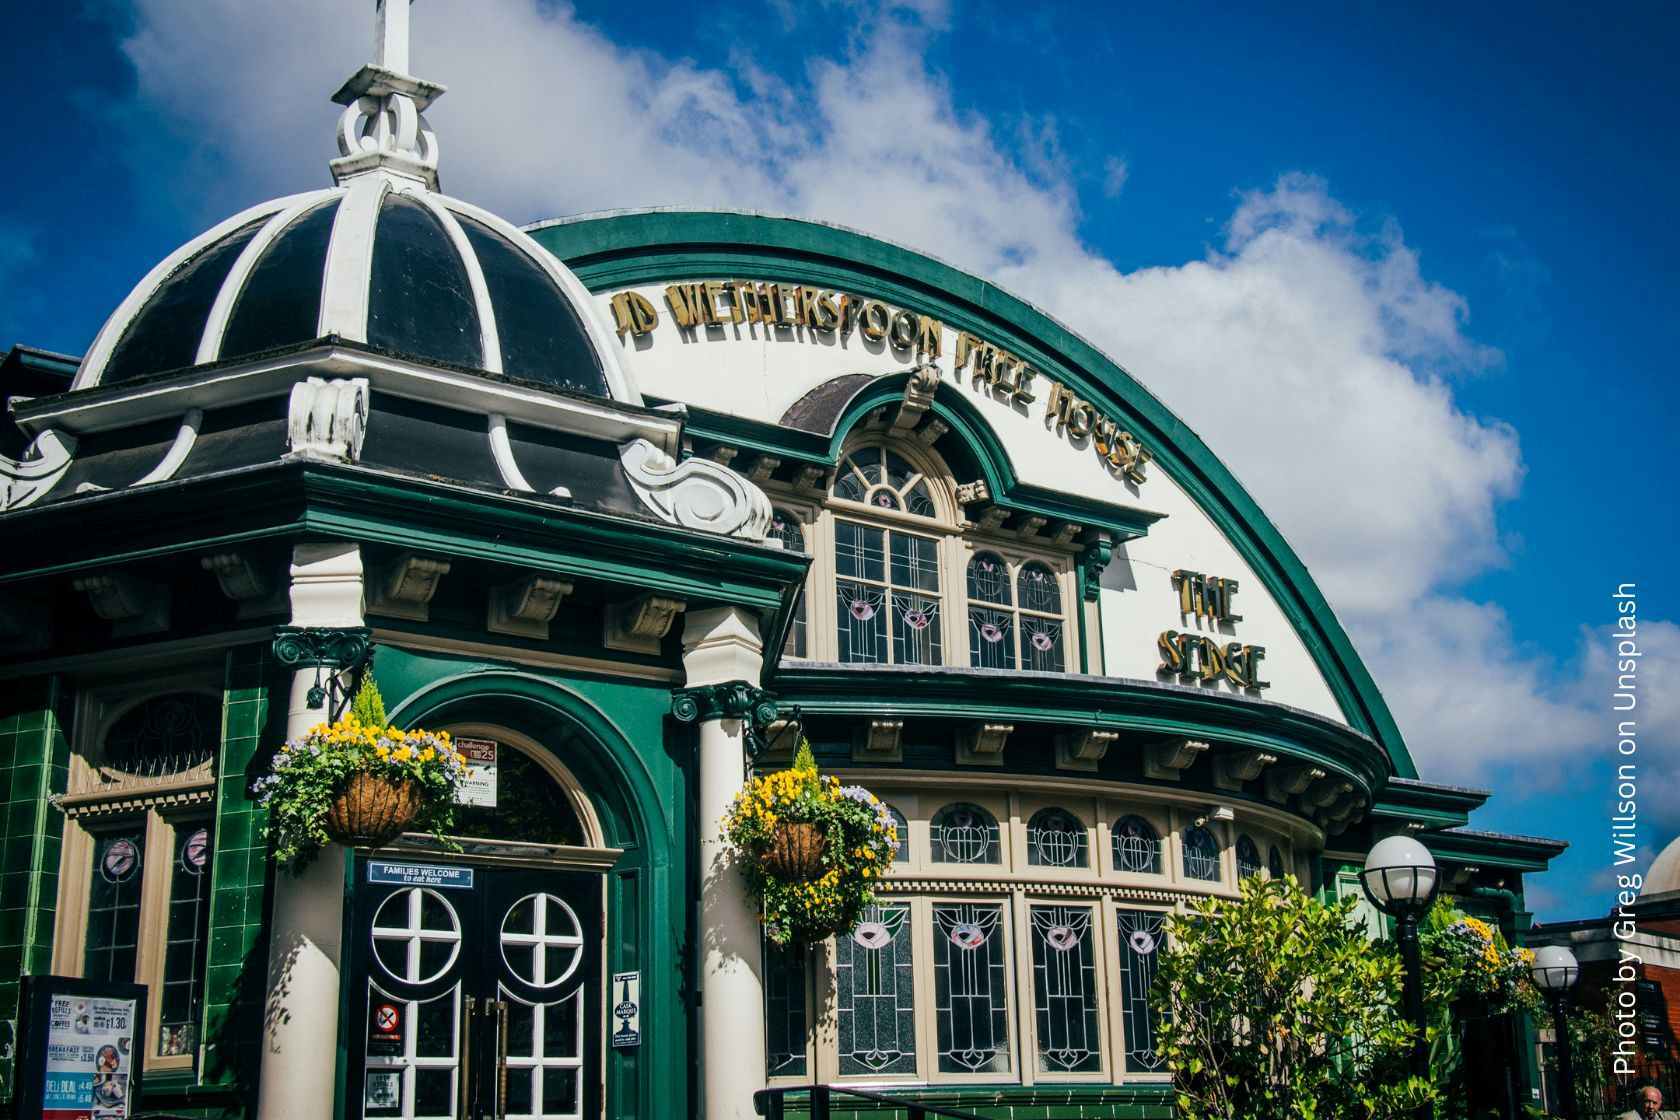
JD Wetherspoon
Ticker: JDW LN
Price: £6.93
Mkt Cap: £0.9bn
EV: £1.6bn
Despite visiting Wetherspoon’s pubs countless times, I have not focused on its stock for long. I only realised it was a public company in May 2017, when its founder, chairman and largest shareholder (23.9%), Tim Martin, spoke at the London Value Investor Conference. I have attended all the conferences since except for 2020, when it was cancelled due to COVID.
I was lucky that when I looked at it in 2017, it did not strike me as a bargain. I also thought running a pub was hardly a great business model (high fixed costs, hard to differentiate, high penetration, mature market). The stock is down since 2017. It was around 850p and now at 693p. However, it did rise to 1,734p, so I could have more than doubled my money if I could time my sale well.
Despite operating in a dull industry, the company’s performance up to COVID was spectacular, leaving many hot tech companies in the dust. It was founded in 1979 by Tim Martin, who decided to call the company after a geography teacher with the surname Wetherspoon (the teacher told Tim that he thought he would never amount to much).
By 1984, JDW had just one pub. In 1990, the company ran 19 pubs with £7mn in sales, earning 0.4p in EPS and FCF per share. By 2019, there were 879 pubs (46x growth), while sales hit £1.8bn (258x growth). The company’s earnings and FCF per share reached 75.5p and 92p, respectively, increasing 189x and 230x, accordingly.
Wetherspoon has been focused on providing quality service and below-market prices. While efficiency is at the heart of its operations, it is also intensely focused on employee retention. An average pub manager has been with the company for over 14 years in H1 ’23, up from just nine years in 2013. Kitchen managers have also seen their average length increase from 6 years in 2013 to 10.6 in H1 ’23.
99.1% of its pubs received the highest hygiene rating (5), higher than any other operator. Two hundred of its pubs were listed in CAMRA’s Good Beer Guide in 2023.
A recent survey by market researchers CGA indicates that the average income of Wetherspoon customers is 7% above that of the average ‘high street pub consumer’, which is contrary to a widespread perception of Wetherspoon pubs selling ‘cheap’ beer for customers outside of high-income groups.
Using financials for the last year before COVID (2019), JDW is currently valued at 13.2% FCF yield and 9.2x PE ratio.
COVID forced the company to close its pubs for about 100 days in FY-20 and 19 weeks in FY-21 (ended on 31 July 2021). As a result, JDW saw declining sales and reported net losses for both years. The immediate risk to JDW from COVID was remaining solvent. It was an immense risk but reasonably short-term, and it has passed.
Two other consequences of COVID still affect business performance. First, its inflation and labour shortage. The second issue is the changing pattern of consumer behaviour as more people have started to drink at home rather than in pubs. While inflation and labour shortage can be fixed in a market economy (although probably not as fast this time), the behaviour changes can be long-lasting.
But even despite those challenges, the company’s performance has been steadily improving, with H1 ’23 sales reaching £916mn (on track to exceed 2019 levels). Like-for-like sales grew 5.0% in H1 ’23 and accelerated by approx. 7.4%. in H2 ’23 (up 11% in Q4 ’23). Weekly sales per pub increased to £50.1k during H1 ’23, which exceeded the previous record of £48.0k in FY-19.
Importantly, Wetherspoon is increasing the share of food and other non-alcohol sales in its revenue mix. Since 2000, bar sales have declined from 76% of total revenue to 57% in 1H23, while the share of food has increased from 18% to 38% over the same period. Since 2009, the company has been growing hotel operations and now operates 57 hotels across the UK and Ireland. Most of its hotels are complimentary to its pub operations and often share the same property and infrastructure.
As of 9 July 2023, net debt was £688mn, approximately £114mn lower than at the start of 2020, immediately before the pandemic. After the start of COVID, the company has invested £116mn in new pubs, £82mn in freehold reversions, and raised equity of £240mn.
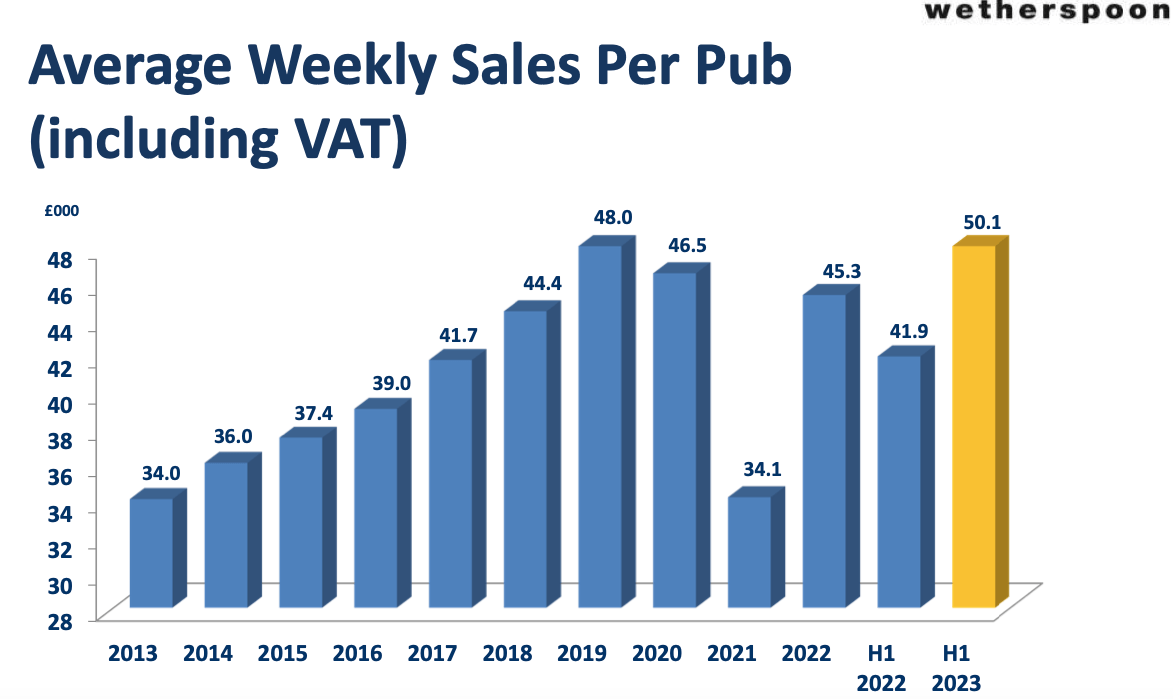
Source: JD Wetherspoon Investor Presentation
It is also relatively rare to see key executives working for a company for 20-30 years. The current CEO, John Hutson, joined JD Wetherspoon in 1991 and has been a board member since 1996. Ben Whitley, CFO, has been with the company since 1999. Personnel and retail audit director, James Ullman, joined the company in 1994.
It is encouraging that on 1 February 2023, Tim Martin increased his stake in the company by buying 2.6mn shares on the market for £4.57 a share. Other directors also bought shares this year, including non-exec Harry Morley (5,500 shares for £5.33 a share).
On 12 May 2023, the company’s CEO, John Hutson, sold 18,000 shares for £7.8 a share. This is, of course, less encouraging, but generally, an insider buy sends a stronger positive message about the company’s prospects than an insider’s sell. There are many reasons a manager may want to sell his shares (pay taxes, settle a divorce, support a quality lifestyle), but usually just one reason for buying shares.
In 1996, JDW launched a share ownership plan for thousands of its employees to encourage them to think more like business owners. Since then, 23.4 million shares have been awarded, which equates to 18.2% of all the shares in existence today. 14,000 employees were awarded free shares in March 2023.
The company stopped paying dividends during COVID. During 2011-19, JDW used to pay a 12p full-year dividend. Management also spent over £140mn on buyback from FY-12 until FY-18.