


4 February 2024
I have recently joined the Annual Forecasting event organised by the UK CFA Society. Over 100 participants, split into 18 groups, were tasked to allocate capital for 2024 between seven asset classes. To set the context, the organisers asked two experts from the UK financial industry to present their outlooks and participate in a short panel discussion.
Here is the average allocation of all 18 groups:
Here is the average allocation of all 18 groups:

Almost 60% was allocated to equities split between MSCI World (39.4%), Emerging Markets (14.5%), UK (all-share index - 5.6%), UK 5-year government bonds (25.3%), Cash (5.6%) and Gold (9.7%). The group at my table made a very similar allocation. However, some groups came up with significantly different allocations.
The factor mentioned most often at my table was geopolitical risks, followed by expectations of rate cuts, especially in the UK and elections.
I also asked the Twitter/X community a similar question, although, with only four options allowed by the platform, I had to remove FTSE and EM asset classes.
Interestingly, the Twitter/X community allocated more to equities (65.5%), gold (16%) and cash (10.1%) and much less to UK gilts (8.4%). This makes sense, considering the more diverse geographic locations of Twitter users.
Since producing year-ahead outlooks and allocating money in such a way is quite popular, I thought I should share my two thoughts on this subject.
Since producing year-ahead outlooks and allocating money in such a way is quite popular, I thought I should share my two thoughts on this subject.
Two issues with 12-months allocation
Firstly, any portfolio should consider its owner's personal circumstances. Capital allocation for a 25-year-old person with a rising salary will be very different from that of a retired person who plans to rely on their capital to sustain their living. It is pretty apparent, so I will not expand on this.
The second point is more serious. Since we were not given further details about the person we were constructing a portfolio for, it is fair to assume that the goal was to come up with the allocation that would produce the best returns in the next 12 months. Assuming risk (measured as volatility) was not part of this equation (since we were not given a profile of a capital owner), then the goal should have been to achieve the highest percentage gain plus any income within the 12-month period (not the highest Sharpe ratio or anything like that).
The second point is more serious. Since we were not given further details about the person we were constructing a portfolio for, it is fair to assume that the goal was to come up with the allocation that would produce the best returns in the next 12 months. Assuming risk (measured as volatility) was not part of this equation (since we were not given a profile of a capital owner), then the goal should have been to achieve the highest percentage gain plus any income within the 12-month period (not the highest Sharpe ratio or anything like that).
How do you win this competition?
So, how do you approach this challenge? From my point of view, the easiest way to win is to put 100% of capital into equities and extend the duration of the competition from twelve months to twenty years.
Why?
Well, it is fairly simple. Stocks have produced the best investment returns over the long run, better than Bonds, Cash, Commodities and Real Estate. The table below was published in a 2017 paper by the Federal Reserve Bank of San Francisco. It covers the 1870−2015 and includes 16 markets (European, North American and Japanese, not China, India or other Emerging Markets).
Global returns for 16 countries covering 1870−2015
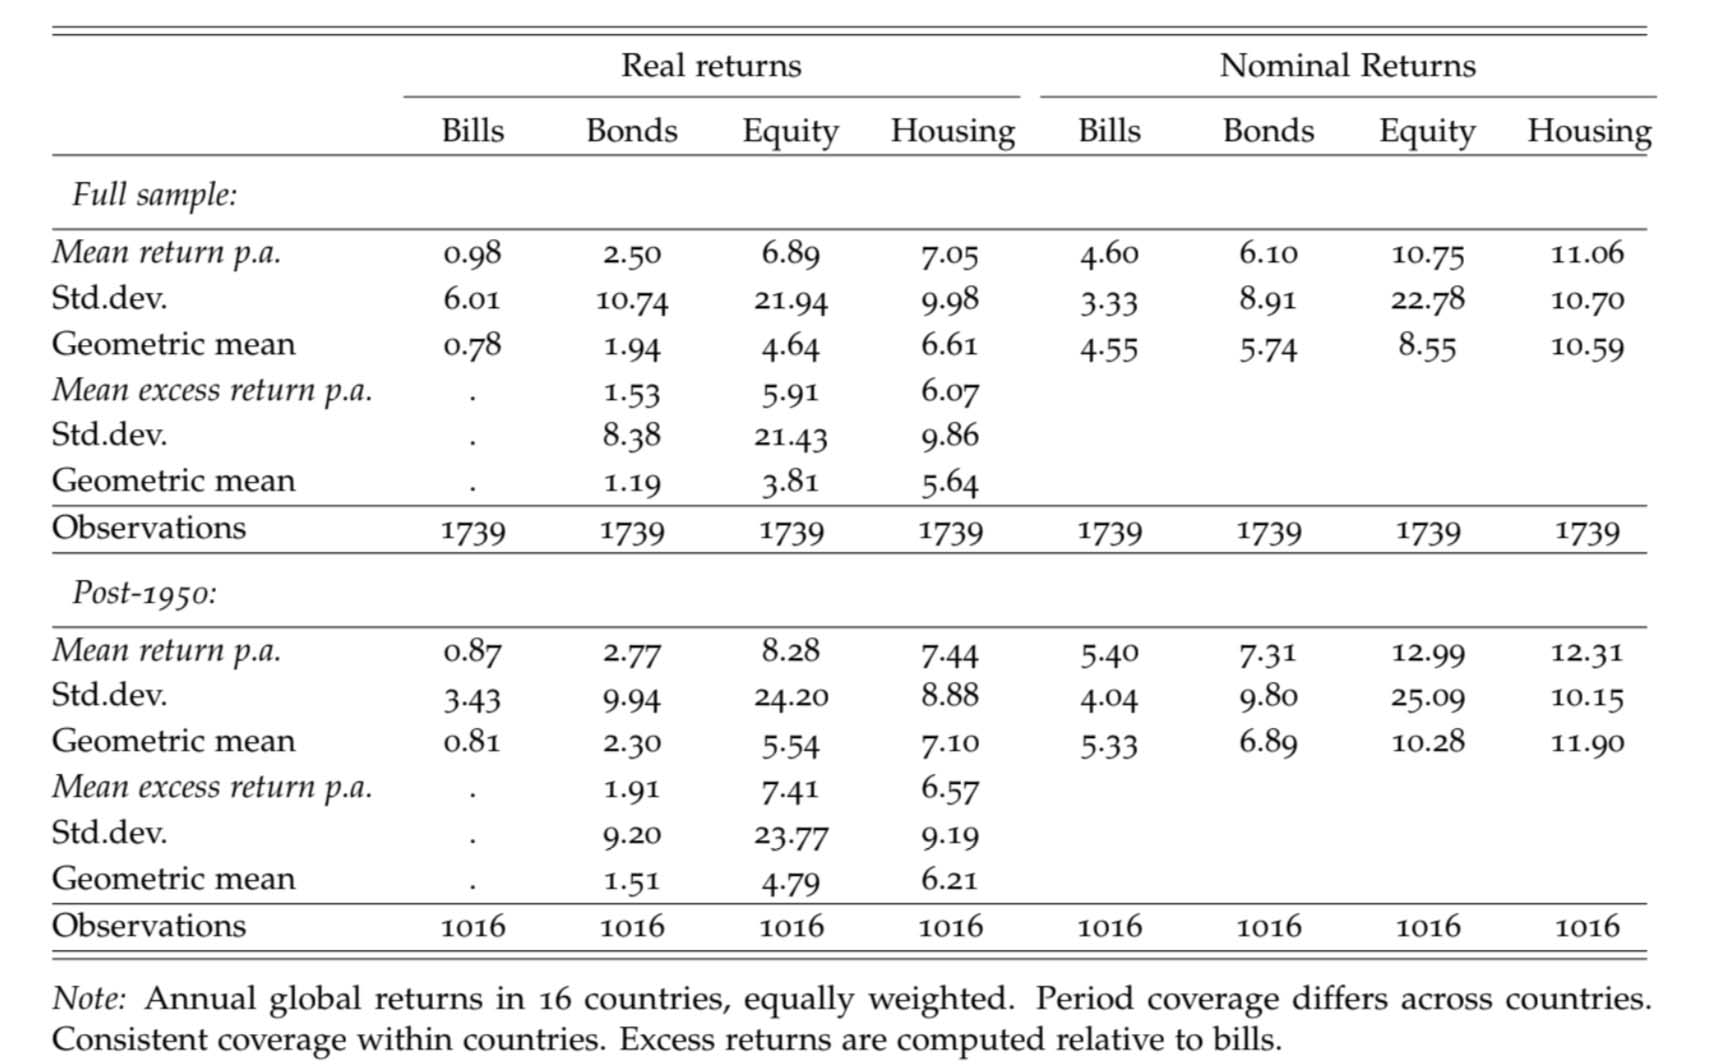
Their returns are pretty easy to break down into key components. The first is the general economic growth, which Bonds fail to capture. If the Market Cap to GDP ratio stays the same, stocks should match GDP growth in the long term. The second is inflation (in the long run, the value of stocks matches the size of the economy in nominal terms). The third is the cash distribution to shareholders (dividends and buybacks). Individual firms can also achieve share price growth through improved profit margins and better incremental returns on capital, but in aggregate, this effect is usually cancelled out.
Businesses can reinvest profits into their operations, expanding their output, launching new products and entering new market niches. These qualities, praised by legendary investors like Warren Buffett, are unique to stocks. Bond investors or holders of gold bars are not able to participate in this growth and have to settle for lower results.
But there is one issue, of course, which is volatility. To achieve 8-10% nominal returns a year, you have to accept that the value of your portfolio will decline regularly and sometimes by a lot.
So, if you put 100% of your savings in equities and expect to win in a 12-month competition, it is a high chance (almost 50%) that you will be disappointed.
Going back to the original competition and the question of how to win it. Frankly, I do not know a secret formula. I am sure you can come up with good reasons for a particular allocation each year and maybe even win the competition, but how much will this be due to luck? Please take a look at the Appendix to this article.
In fact, I think such questions are the root cause of all the miseries for ordinary investors. It is these questions about what will happen to markets (in the next month, quarter, or year) that lead to mediocre results. They sound reasonable, but they are dangerous.
I am sure you are better than this
do not advertise my newsletter and consider it to be a niche publication. So, I am sure my readers already know a lot about the markets, and this chart is unlikely to reflect their portfolio performance.
20-year annualised returns by asset class (2002-2021)
20-year annualised returns by asset class (2002-2021)

Other studies also confirm the data from this chart. Joel Greenblatt, for example, in his book The Big Secret for the Small Investor, referred to an earlier survey by Morningstar according to which the best performing mutual fund had achieved an impressive 18% annual returns over the previous decade, “yet the average investor in this fund managed to lose 11% per year over those ten years.”
The reason is that investors were most interested in investing in this fund after a period of solid returns. But by the time they invested, the fund faced weaker periods of negative returns. Even worse, investors could not endure this downturn and exited at lower prices.
I am not defending poor investment results in the short term, but I do share the data that suggests they are almost inevitable in the process of achieving the best results in the long term. Perhaps Stanley Druckenmiller is the only publicly-known investor who has generated impressive (c. 30%) without a single down year. I view this as more of an exception.
In the same book, Greenblatt shares the data from the Davis Advisors study (2000-2009), which shows the following:
Looking at just the top quartile of managers over a recent decade, almost all of these top-performing funds (95 per cent) spent at least one three-year period during the decade in the bottom half of the performance ranking. Even more telling, 79 per cent spent at least three years in the bottom quartile and a staggering 47 per cent spent at least three years in the bottom 10 per cent
Zooming out
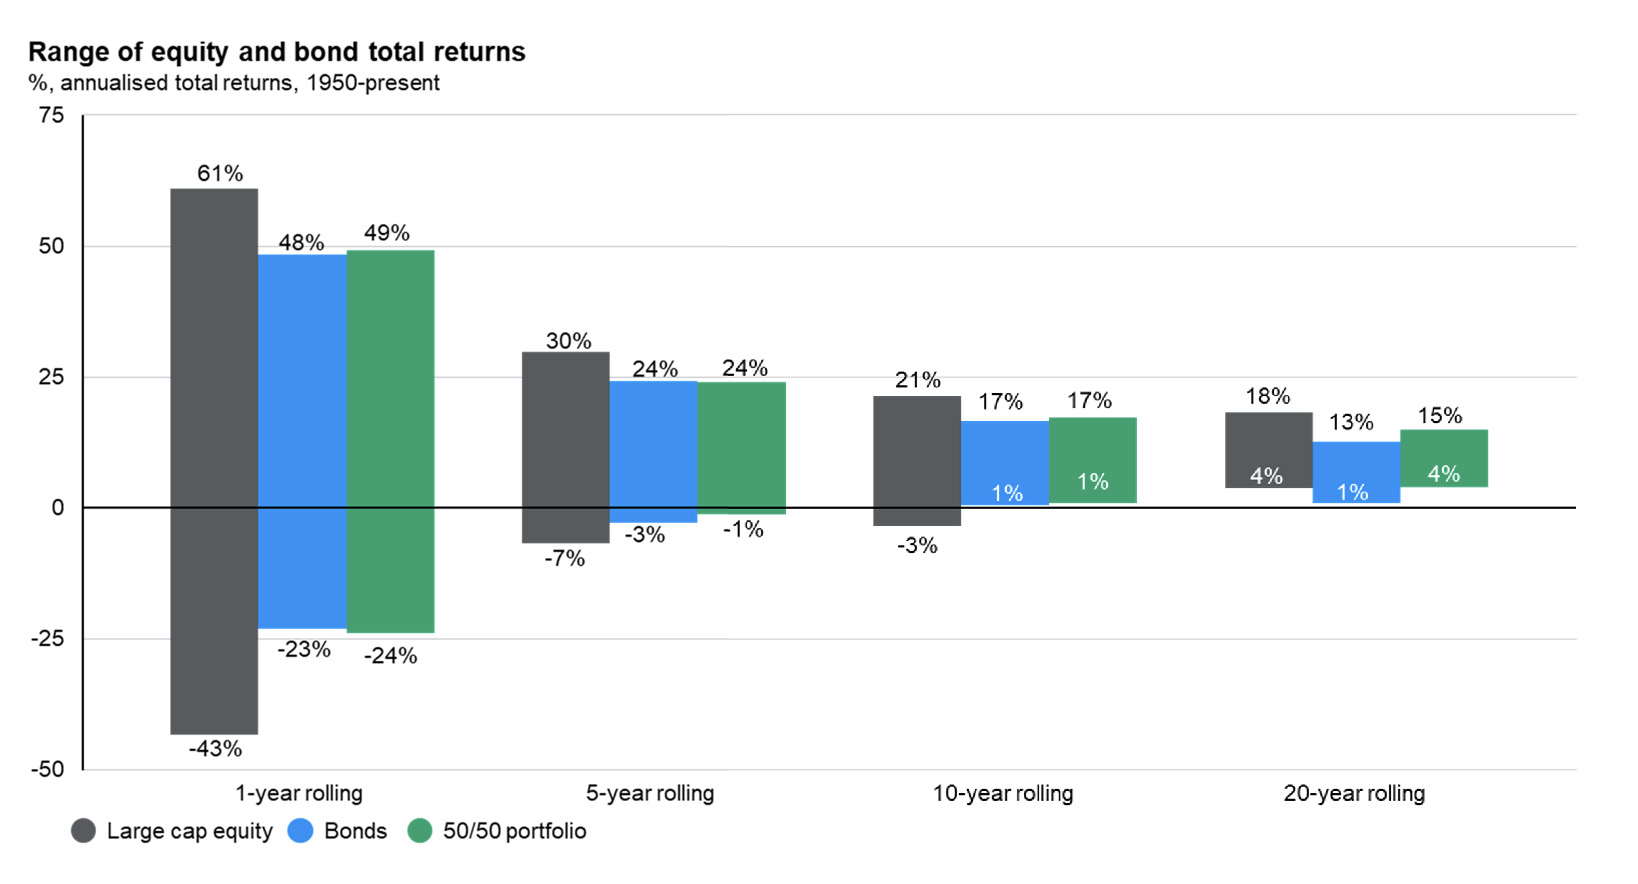
Even the broad market performs similarly. Market performance in the short term is pretty random which makes forecasting hard. But if you zoom out things get much clearer.
US asset returns by holding period
US asset returns by holding period
Source: JP Morgan Asset Management, Guide to Markets Q1 2024
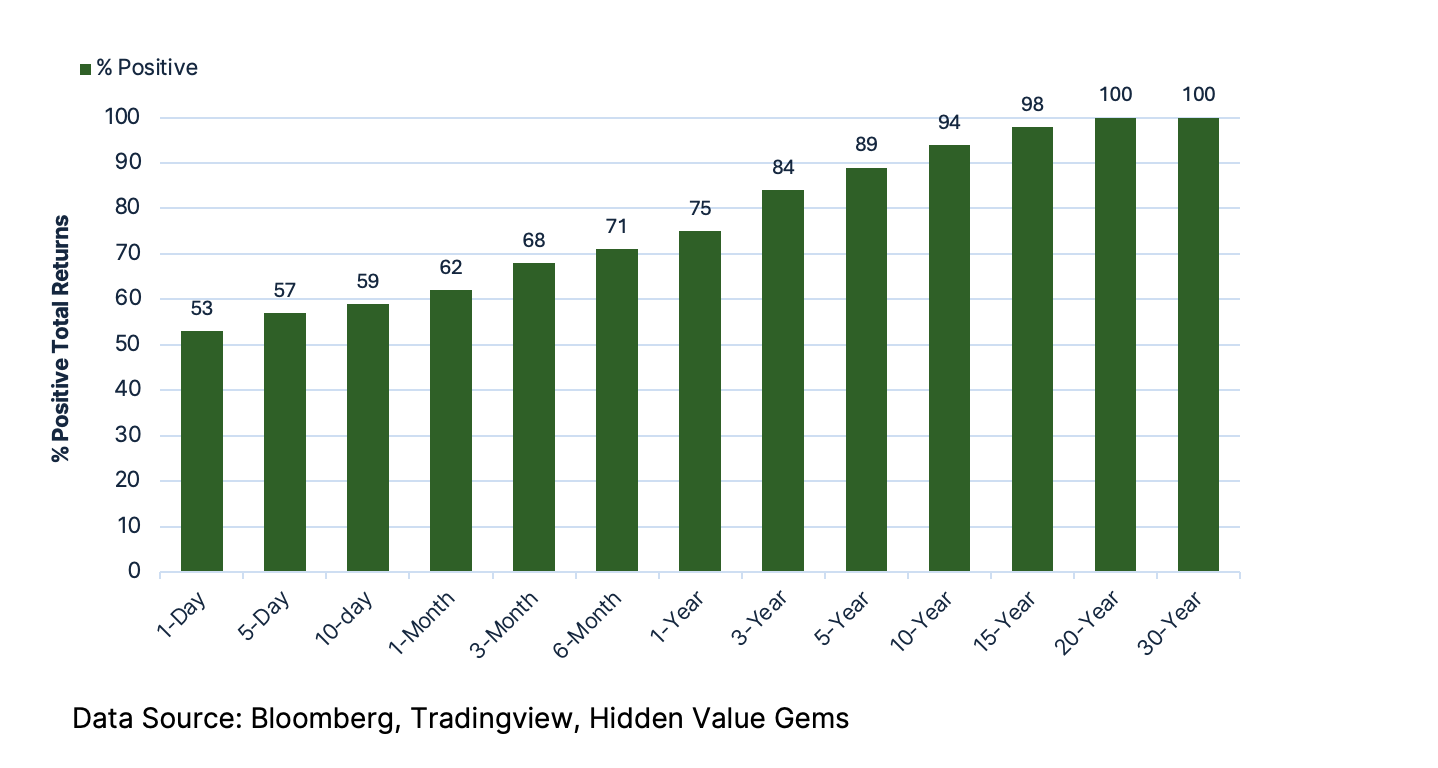
The same message in a different format: there is only a 53% chance that the S&P 500 will be up tomorrow (essentially a coin flip), but 94% in10 years (almost given), 98% in 15 years and 100% after holding the index for 20 or more years.
S&P 500 Total Return: % Positive (1928-2023)
S&P 500 Total Return: % Positive (1928-2023)
Despite strong returns in the long term, markets regularly decline each year. Based on the historical data for the S&P 500 index, the market was positive in 33 out of 44 past years, but investors experienced a 14.2% intra-year drop, on average. Data for other markets show a very similar pattern.
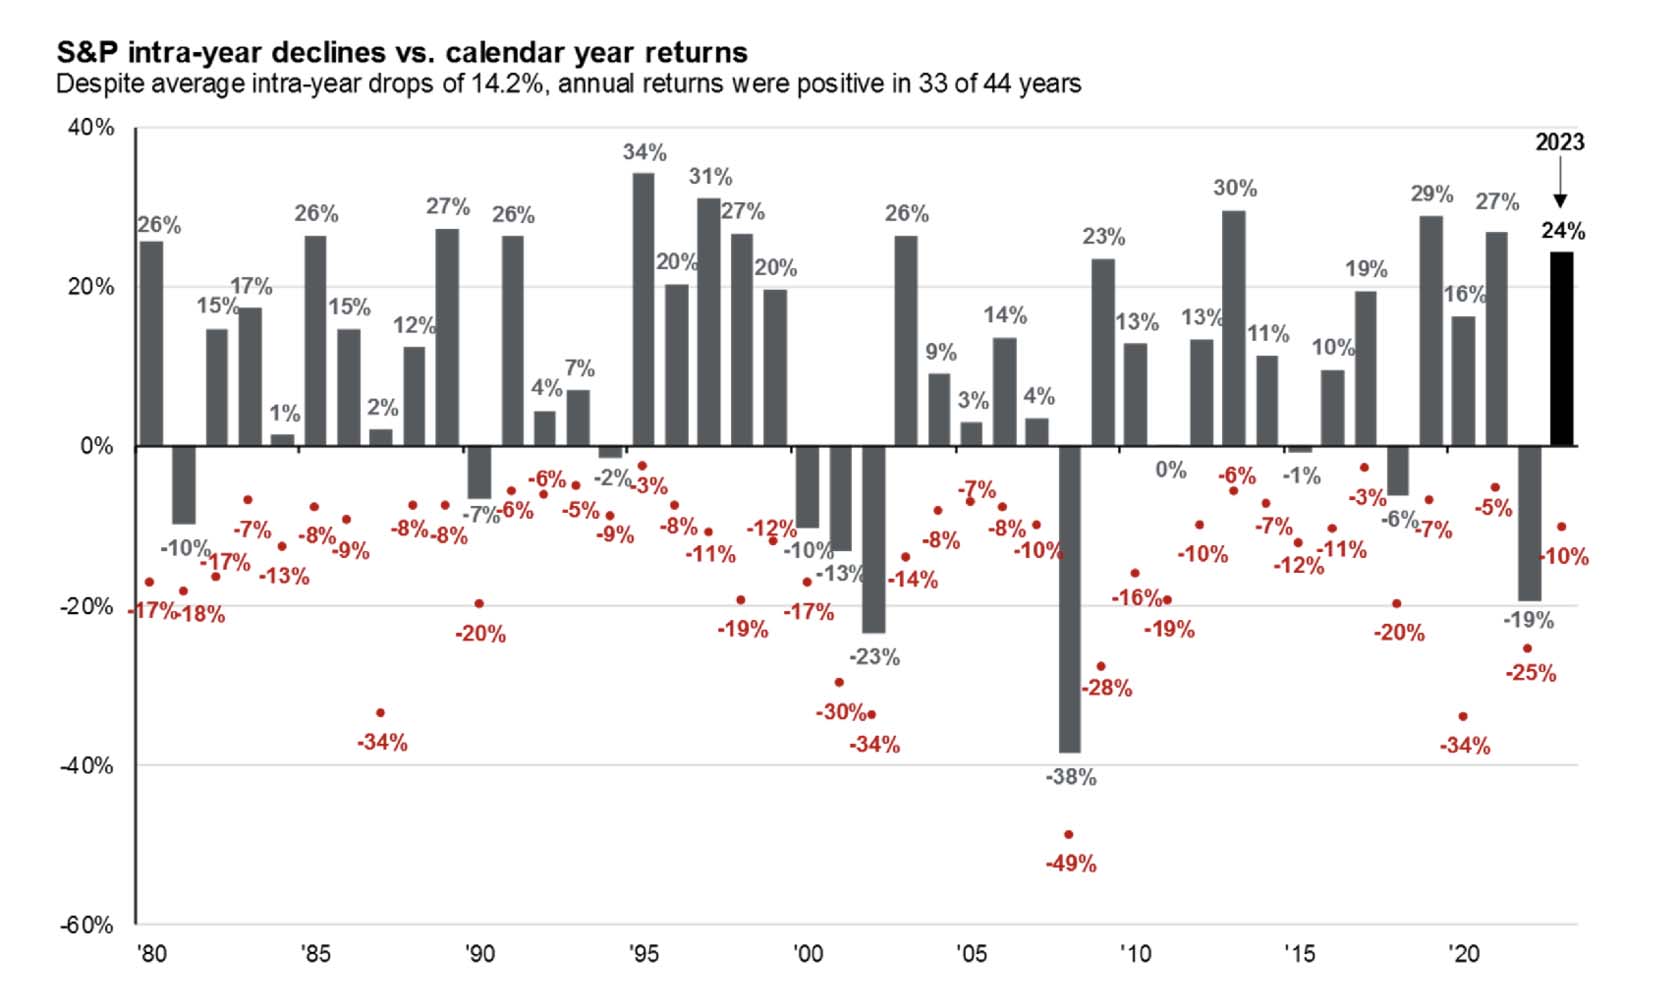
Source: JP Morgan Asset Management, Guide to Markets Q1 2024
How not to make mistakes
To avoid making such mistakes of short-term focus, it is vital to understand their nature. For professional investment managers, reporting their results every month, quarter or year is, unfortunately, part of the game. For brokers, making forecasts is the reason to justify the fees they charge their clients.
Since I am managing my own money, I keep most of my savings in a stock portfolio. Nevertheless, I still find myself asking periodically the same dangerous question (‘What will the year look like for stocks?’).
So, the first step is to ignore such a question. I know it may sound ridiculous, like ignoring traffic when you are driving. But at the same time, the safer and often the faster way is to stay in the same lane. Weaving in and out leads to more accidents and sometimes ends in longer travel time.
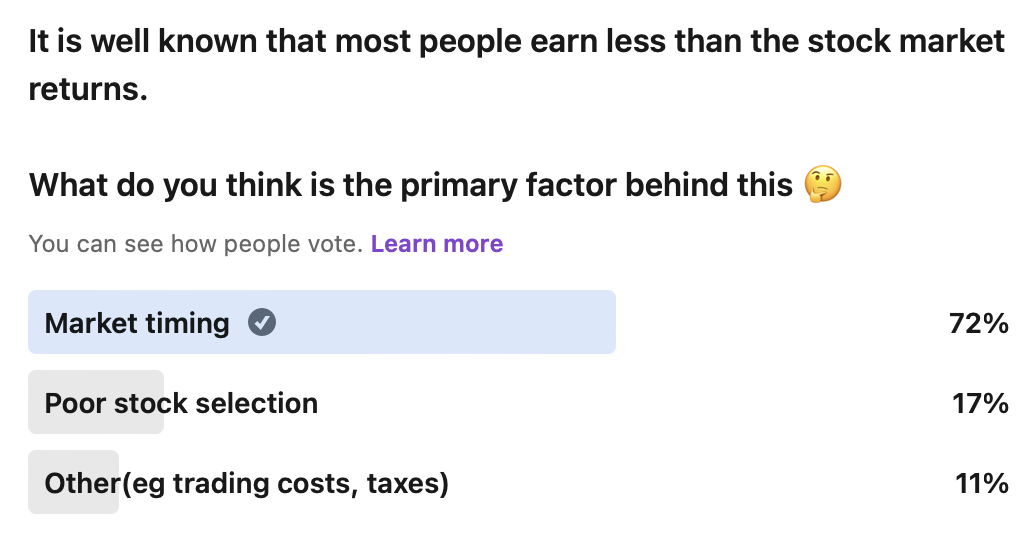
I also asked X and LinkedIn communities what they believe is behind the underperformance of an average investor. 55% of X and 72% of LinkedIn respondents believe it is market timing, with another 33% and 17% pointing out a poor stock selection.
Since I am managing my own money, I keep most of my savings in a stock portfolio. Nevertheless, I still find myself asking periodically the same dangerous question (‘What will the year look like for stocks?’).
So, the first step is to ignore such a question. I know it may sound ridiculous, like ignoring traffic when you are driving. But at the same time, the safer and often the faster way is to stay in the same lane. Weaving in and out leads to more accidents and sometimes ends in longer travel time.
I also asked X and LinkedIn communities what they believe is behind the underperformance of an average investor. 55% of X and 72% of LinkedIn respondents believe it is market timing, with another 33% and 17% pointing out a poor stock selection.
I agree with the majority that it is market timing that is the biggest on our performance. I can think of at least five biases that make us time the market.
1. Loss aversion. Losing one dollar is twice as painful as the pleasure from gaining one dollar)
1. Loss aversion. Losing one dollar is twice as painful as the pleasure from gaining one dollar)
2. Recency and availability bias. We put more emphasis in our analysis on the most recent events or facts that we can easily recall. For example, the news on the military conflicts in Ukraine and the Middle East weighs more significantly in our analysis and makes us favour gold or cash.
3. Overconfidence. The best illustration of this is that about 80% of drivers believe they are above average at driving, based on several surveys. In the stock market, it is pretty similar, although I have not seen any specific poll on this.
4. Expert curse and confirmation bias. People who make their projects public are more willing to defend them by seeking facts that support their views and rejecting data that goes against them.
5. Social pressure, FOMO (fear of missing out). It is hard to stick to your views when people around you are getting rich, speculating in cryptocurrency or meme stocks. Due to this bias, we are less inclined to do our own analysis and more likely to follow others.
6. We are willing to see the world as a logical place with causes and effects rather than quite a random place. As a result, we can easily believe in a message presented as a convincing story rather than complex data points. An investor who listens to a well-known market strategist with a persuasive story about geopolitics and inflation will act based on this story and ignore other important factors.
Is it really worth winning on a twelve-month basis? Short-term results are important for institutional investors in attracting clients. The best way to beat this game would be to have a diverse range of strategies that would deliver above-average results in specific market conditions but, on aggregate, would match the broad index at best (before fees).
My personal goal is to generate maximum wealth in 20-30 years ahead. The best way to do this for most people is to own a broad-market ETF, S&P500 or MSCI World (this is not personalised financial advice, of course). Specific sectors or individual stocks may do much better in any given year. However, constantly switching between asset classes or sectors rather than holding quality businesses or a broad-market ETF will lead to disappointing results.
I keep my personal savings in individual stocks, which I pick based on the five criteria I have discussed before: business quality, financial performance, leverage, insider ownership and valuation.
It is unpleasant to see your portfolio lagging the market, but it is the price to pay if I want to achieve solid results in the long run.
Stock selection
Many of the biases that cause us to over-trade and try to time the market also lead to flaws in our analysis of individual stocks. But apart from those biases, one aspect of equity investing is vital and little discussed. I mentioned this in one of my first posts (Why most people lose money in the stock market? The big math secret.)
The critical point is that stock returns are positively skewed, which in plain English means that a small group of super stocks generate the bulk of returns, while most stocks generate quite average returns. Here are some interesting facts:
The critical point is that stock returns are positively skewed, which in plain English means that a small group of super stocks generate the bulk of returns, while most stocks generate quite average returns. Here are some interesting facts:
- From 31 Dec 1997 until 31 Dec 2017, half of the stocks in the S&P index delivered results in the range of -100% to +50% (some went bust), while the average change in the S&P index was +228% over the same period.
- Returns of stock investors are typically lower than stock market returns: the return differential is 1.3 per cent for the NYSE/AMEX market over 1926-2002, 5.3 per cent for Nasdaq over 1973-2002, and an average of 1.5 per cent for 19 major international stock markets over 1973 to 2004, all highly statistically significant.
- A tiny group of stocks account for a disproportionate share of overall returns. All wealth generated by US stocks since 1926 (26,168 stocks) was generated by just 4% of those stocks (1,092). The remaining 96% of stocks generated returns that only matched T-bills performance. From 1926 to 2019, 57.8% of US stocks (15,132 out of 26,168) generated returns below cash yield. 41% of wealth has come from just 0.2% of companies (50 out of 26,168).
- The single most common outcome for stocks has been a 100% loss (companies went bust). The median life of a stock is only seven and a half years (although some of this shortness is due to M&A activity rather than bankruptcies). The median return of a stock over a lifetime has been a negative -2.3%, even though an average (mean) return for a stock in the same group has been a positive 187%.
CONCLUSION
If there is one point to take away from this post, it is that forecasting the next twelve months is not only pointless but also value-destructive. There will always be surprises.
An investor who never wins in the annual competition because his portfolio generates 'modest' 10-12% returns can easily beat 99% of market participants on a 10-year horizon.
A portfolio of stocks that tracks a broad index would generate better returns than other asset classes in the long run.
I am more comfortable owning a small group of companies that can compound capital at an attractive rate. They usually have the five traits I mentioned above (business quality, strong financial performance, low leverage, insider ownership and attractive valuation.)
One of the reasons I launched this Newsletter is to share my experience finding and holding such companies. Exchanging views and ideas with like-minded investors and sharing the journey together is a special bonus.
Thank you for reading this post. Below is an abstract from the 1984 article by Warren Buffett, which I think you will enjoy.
Appendix
Warren Buffett made a good analogy of chasing short-term performance in his 1984 article The Superinvestors of Graham-And-Doddsville. Here is an excpert from the article:
"I would like you to imagine a national coin-flipping contest. Let's assume we get 225 million Americans up tomorrow morning and we ask them all to wager a dollar. They go out in the morning at sunrise, and they all call the flip of a coin. If they call correctly, they win a dollar from those who called wrong. Each day the losers drop out, and on the subsequent day the stakes build as all previous winnings are put on the line. After ten flips on ten mornings, there will be approximately 220.000 people in the United States who have correctly called ten flips in a row. They each will have won a little over $1,000.
Now this group will probably start getting a little puffed up about this. Human nature being what it is. They may try to be modest, but at cocktail parties they will occasionally admit to attractive members of the opposite sex what their technique is, and what marvelous insights they bring to the field of flipping. Assuming that the winners are getting the appropriate rewards from the losers, in another ten days we will have 215 people who have successfully called their coin flips 20 times in a row and who, by this exercise, each have turned one dollar into a little over $1 million. $225 million would have been lost, $225 million would have been won.
By then, this group will really lose their heads. They will probably write books on "How I Turned a Dollar into a Million in Twenty Days Working Thirty Seconds a Morning." Worse yet, they'll probably start jetting around the country attending seminars on efficient coin-flipping and tackling skeptical professors with, "If it can't be done, why are there 215 of us?"
But then some business school professor will probably be rude enough to bring up the fact that if 225 orangutans had engaged in a similar exercise, the results would be much the same - 215 egotistical orangutans with 20 straight winning flips.”
Buffett then describes the exceptional performance of a select few managers who follow Graham's value approach.