10 March 2024
“We’re buying things at four times earnings, five times earnings, and we’re buying them where they have huge buybacks and we can’t count on other long only investors to buy our things after us. We’re gonna have to get paid by the company. So we need 15, 20% cash flow type of type of numbers. And if that cash is then being returned to us, we’re gonna do pretty well over time.”
- David Einhorn, founder of Greenlight Capital
Choosing stocks with the largest buyback programme is not a new strategy, of course. In 2016, another practitioner and value investor, Mohnish Pabrai, co-wrote an article in Forbes introducing the concept of ‘Uber Cannibals’. The backtest of this strategy generated an impressive 15.5% annualised return for the 1992-2016 period, compared to 9.2% for the S&P 500.
Warren Buffett is the best-known investment legend that speaks favourably about buybacks. Every year, he reminds shareholders of Berkshire Hathaway how their interests in companies rise without Berkshire spending a dime on this. Here is, for example, what he wrote in his latest letter:
Warren Buffett is the best-known investment legend that speaks favourably about buybacks. Every year, he reminds shareholders of Berkshire Hathaway how their interests in companies rise without Berkshire spending a dime on this. Here is, for example, what he wrote in his latest letter:
“Though Berkshire did not purchase shares of either company in 2023, your indirect ownership of both Coke and AMEX increased a bit last year because of share repurchases we made at Berkshire. Such repurchases work to increase your participation in every asset that Berkshire owns.”
In 2022 shareholder letter, he also noted the following:
“When you are told that all repurchases are harmful to shareholders or to the country, or particularly beneficial to CEOs, you are listening to either an economic illiterate or a silver-tongued demagogue (characters that are not mutually exclusive).”
Theoretical studies largely support this optimistic view, although no study covers a long enough period to call the results statistically meaningful.
Here is, for example, the performance of ‘corporate cannibals’ vs the S&P 500 index, covering 20 years until 2018.
Here is, for example, the performance of ‘corporate cannibals’ vs the S&P 500 index, covering 20 years until 2018.
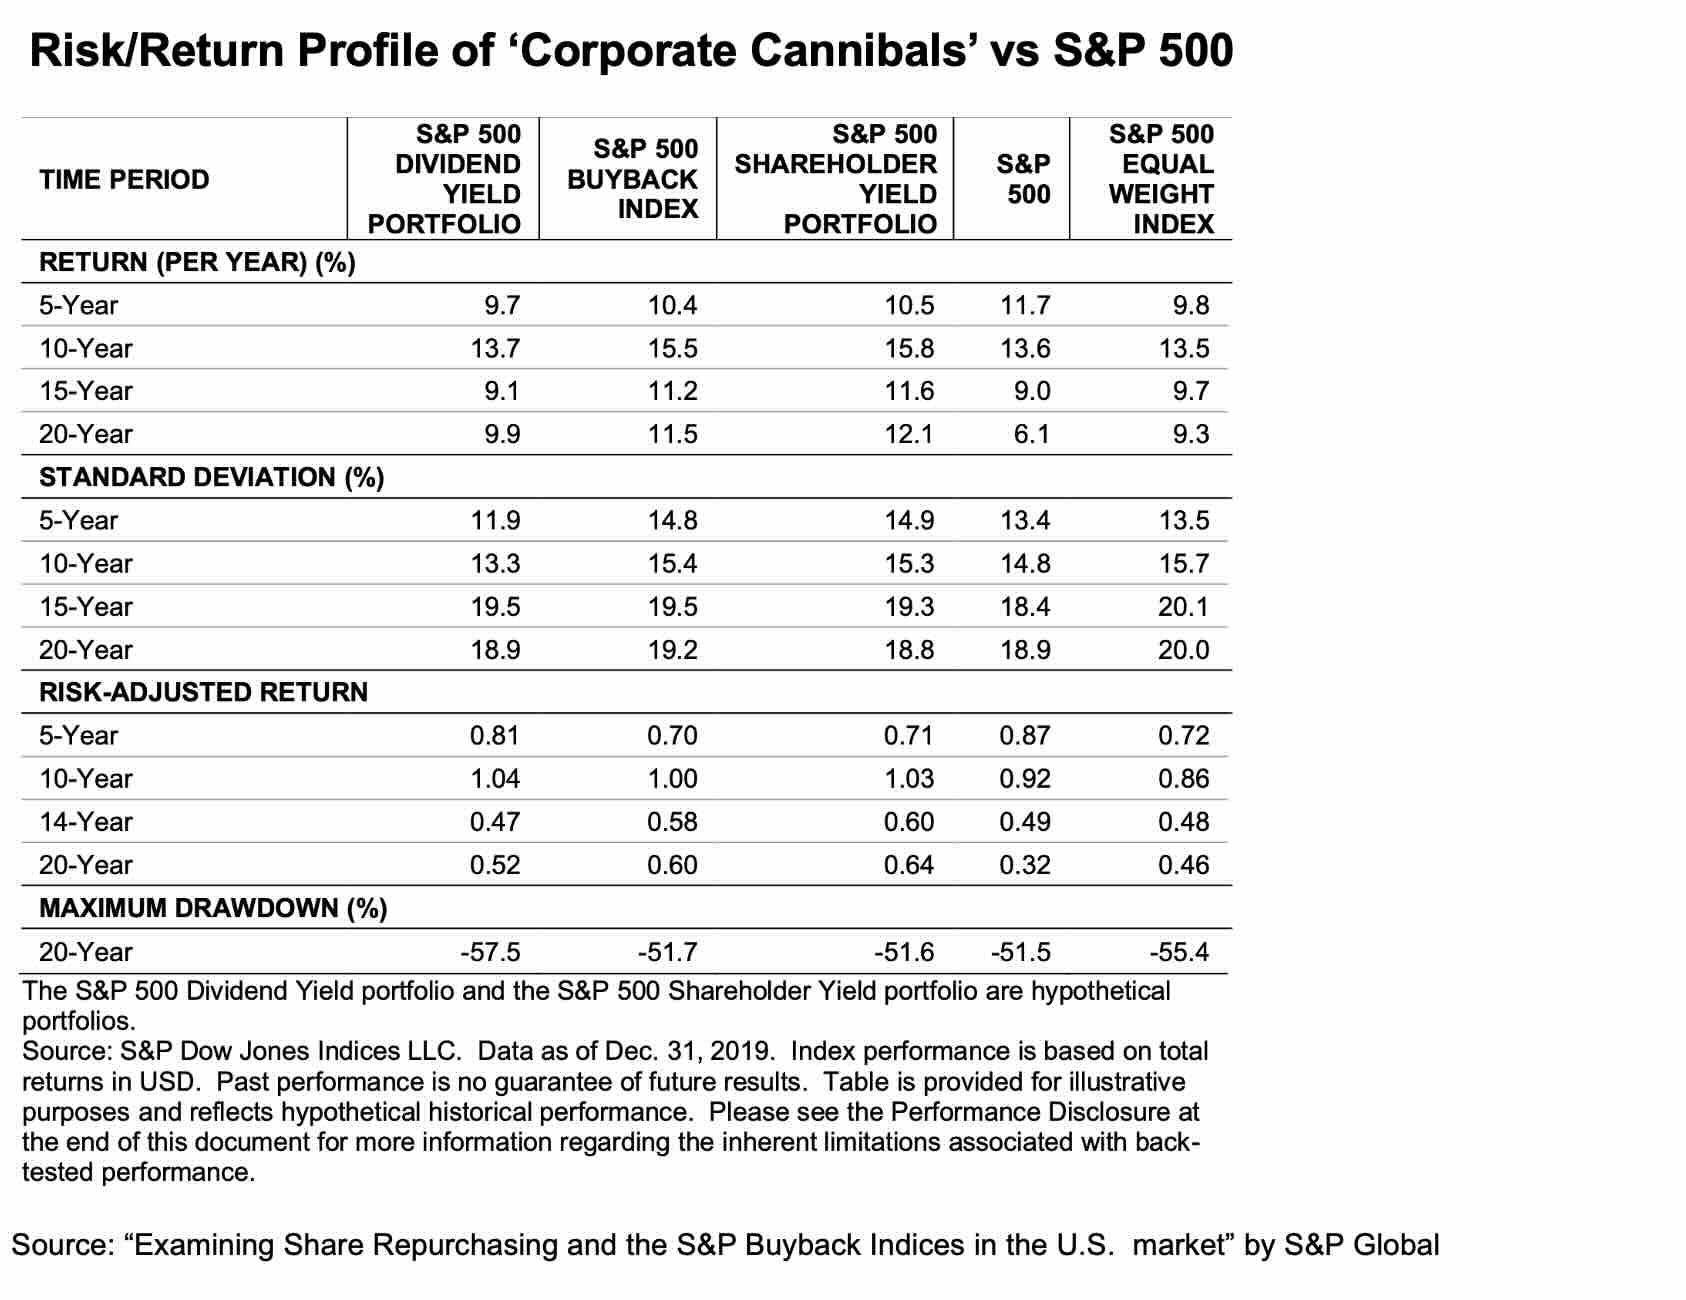
Crucially, buybacks can also lead to colossal value destruction. My concern is that inexperienced investors may take Einhorn’s words directly and chase the stocks with the highest buyback yields. They will be disappointed.
Even Warren Buffett regularly warns about that. This is what he wrote this year:
Even Warren Buffett regularly warns about that. This is what he wrote this year:
“To this obvious but often overlooked truth, I add my usual caveat: All stock repurchases should be price-dependent. What is sensible at a discount to business-value becomes stupid if done at a premium.”
This article has two parts. In the first one, I explain how buybacks can impact shareholder returns and when they work best. In Part II, I review some of the stocks that caught my attention in the Top 150 ‘corporate cannibals’ screen that I ran this week. Feel free to jump straight to Part II.
Part I. Background on Buybacks
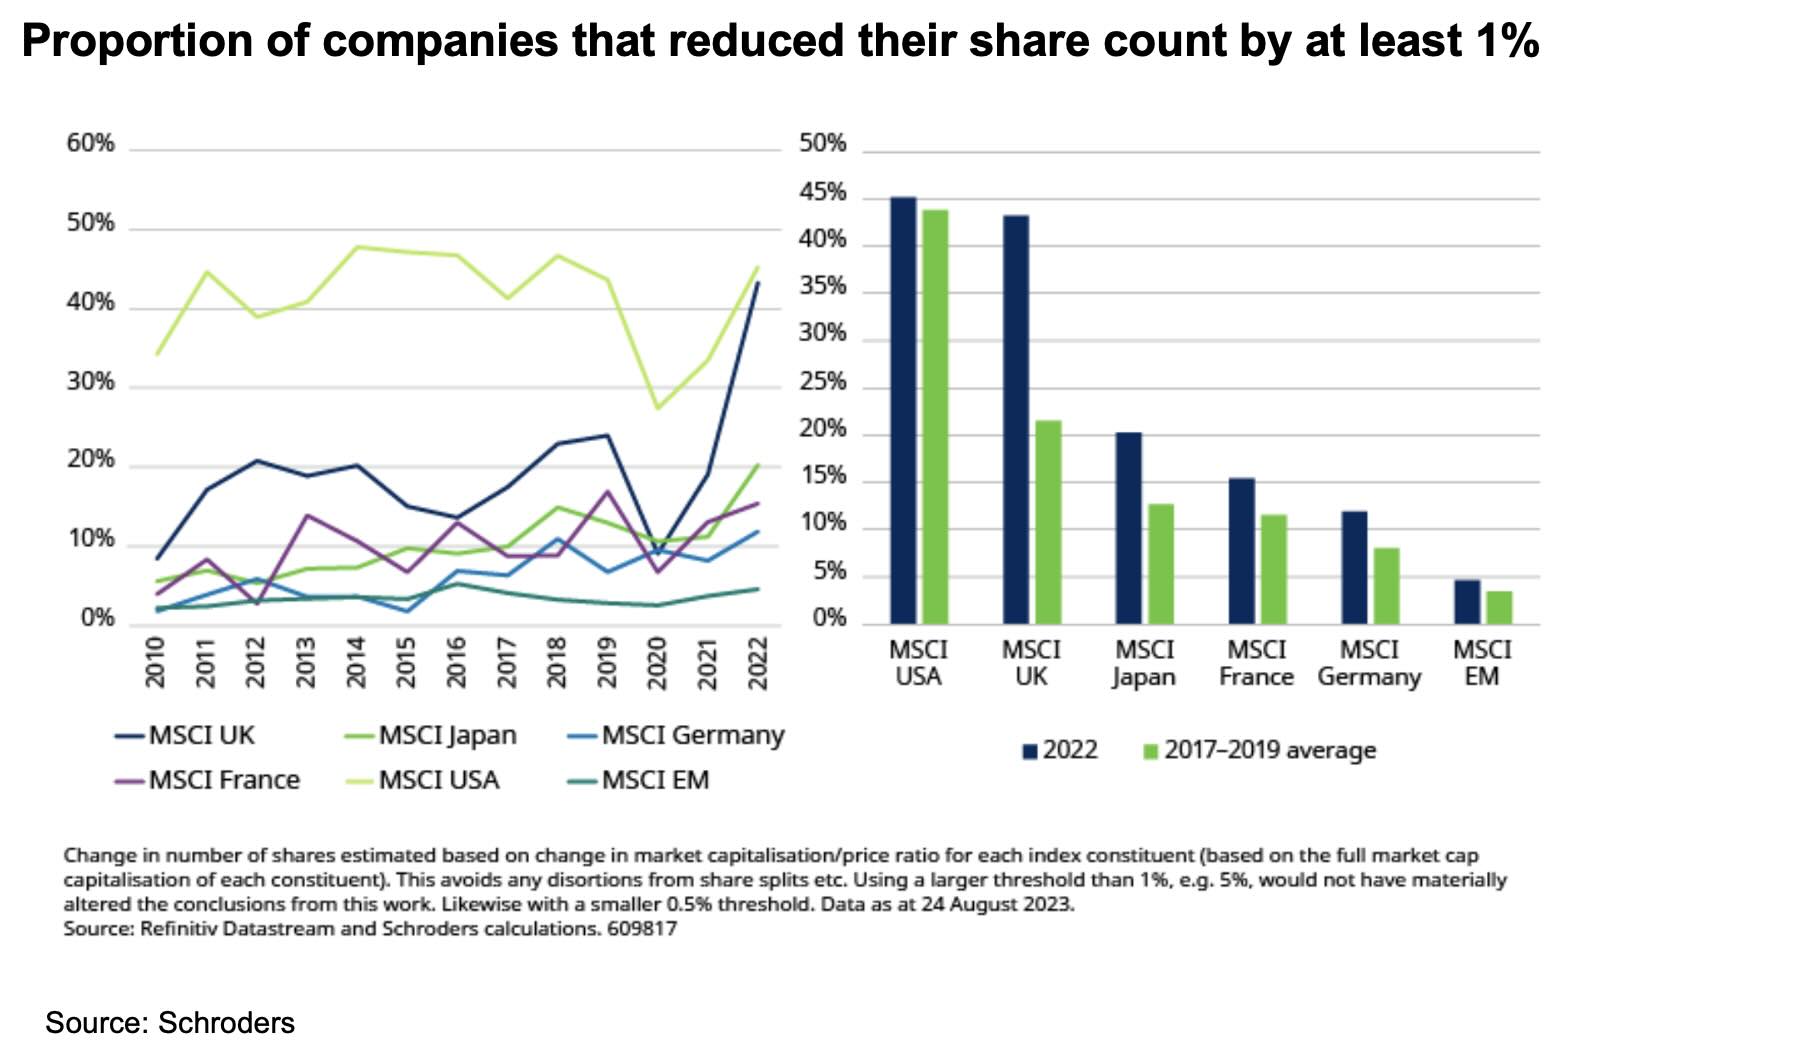
Buybacks are now the most popular form of cash distribution. Over half of the US-listed companies repurchase their shares, spending around $1tn annually on this, more than dividends. International companies have also started to catch up, especially in the UK and Japan.

Buyback Magic
While many studies have pointed out the outperformance of stocks with buybacks relative to the broader market, certain cases seize the imagination.
Take, for example, a mature industry such as auto parts retail in the US. There is little innovation and nothing fancy about it. It has grown broadly in line with GDP (1-3% a year).
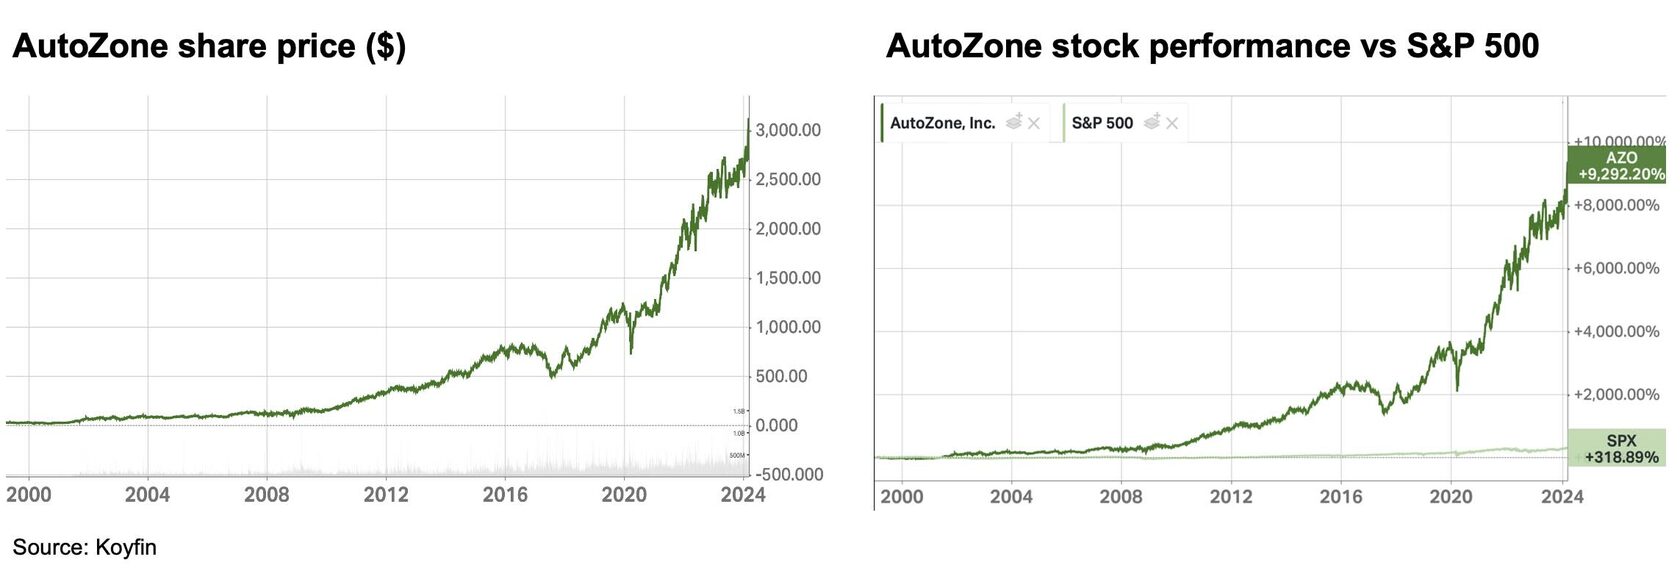
It is mind-blowing that since 1999, AutoZone, one of the leading retail auto parts companies, has generated a staggering 9,289% return compared to ‘just’ 319% for the S&P 500 index.
In other words, the broad market has increased 4x over the past 25 years, which is quite a good result, although it translates into a more modest 5.7% annualised return.
However, AutoZone’s share price has grown by almost 94x over the same period—a compound annual growth rate of 19.9%!
So, how did the company achieve such impressive share price appreciation in a mature sector?
Firstly, the company achieved organic growth through 2% same-store sales (inflation rate). Opening new stores contributed another 5% to the total annual sales growth of 7.0%.
The company also improved its operating margin from 11.8% to 19.9%, focusing on efficiency and benefiting from increased scale. This added 2.1% annual growth to earnings.
There were other factors at play, such as reduced accounts receivable, improving working capital and cash conversion, which freed up capital, and continuous use of leverage (Debt increased fivefold, matching EBITDA growth) - all those other factors added 1.8% to the annual return.

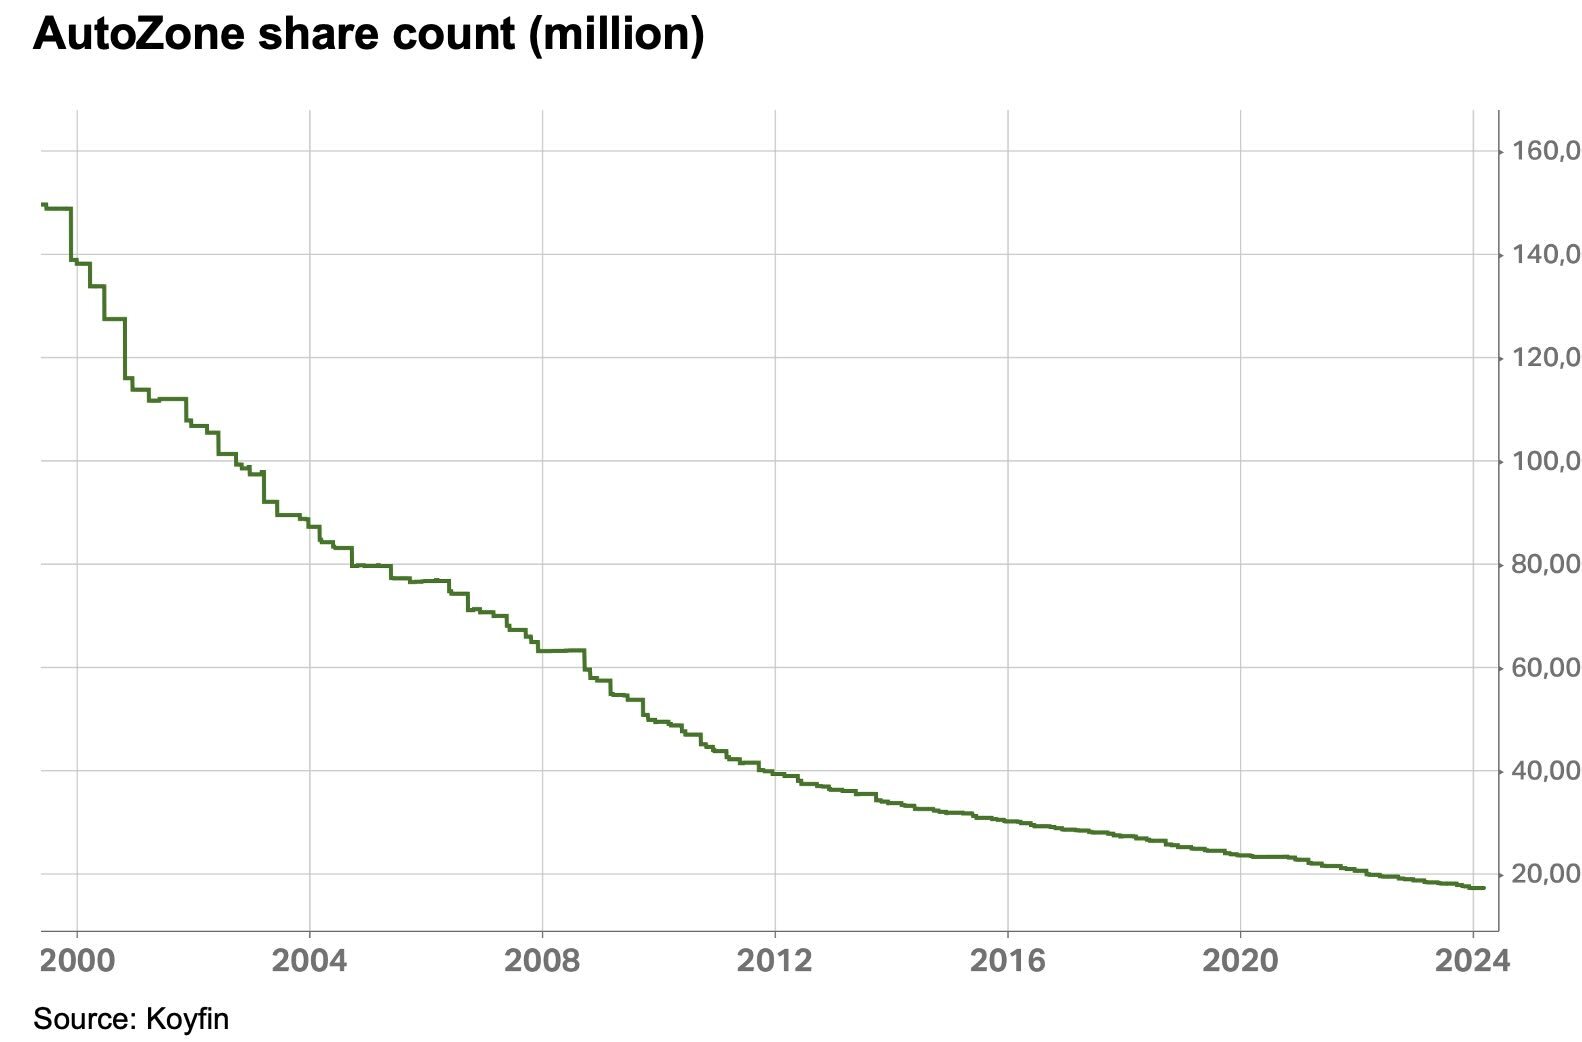
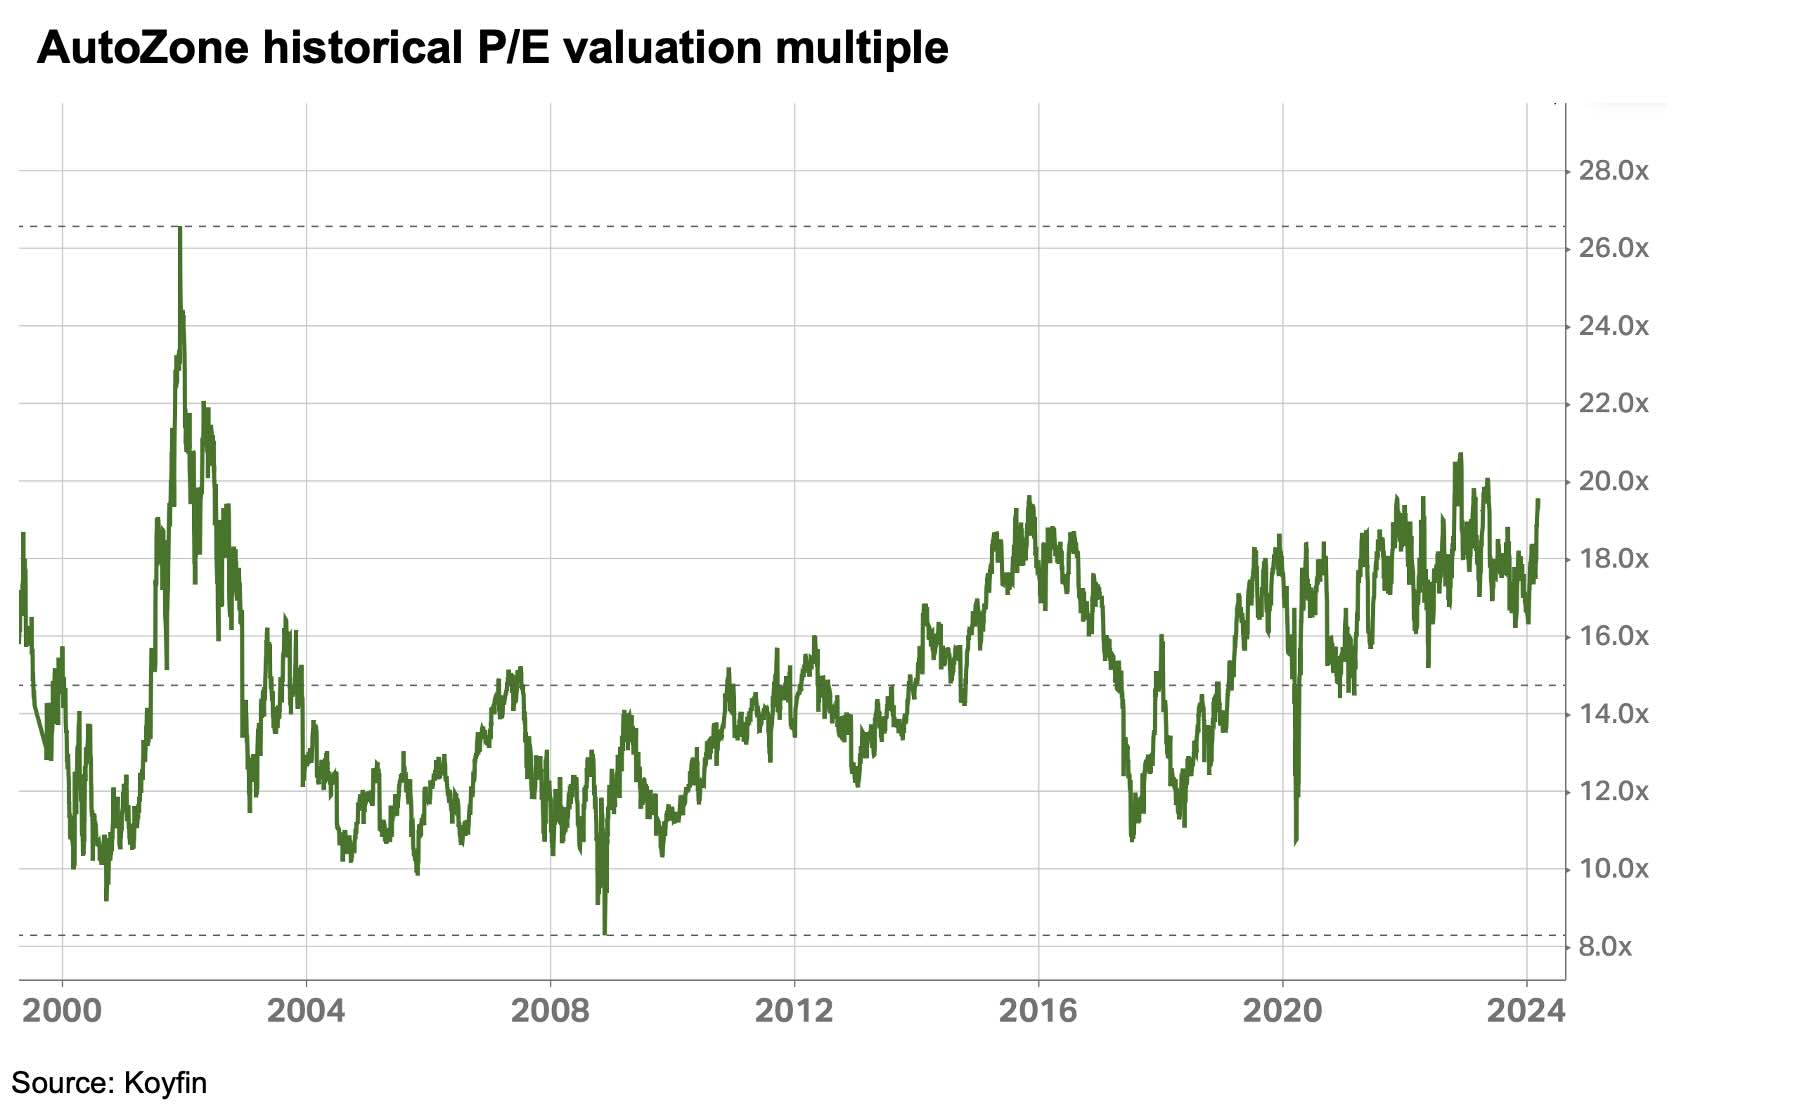
However, the most important driver has been share buyback, as the company has been reducing the number of shares outstanding by an average of 9.0% a year.
Note that the company did not benefit from expanding P/E multiples as most companies did in the past decade. AZO, however, did benefit from a modest valuation discount of its shares, which traded at an average P/E multiple of 14.5x.
The source of the Buyback Magic
Buyback is just one form of capital allocation. Every profitable company has the option at the end of the year to invest its profits back into the business, pay dividends, acquire another business, or purchase its shares from the market. Of course, the options are not mutually exclusive, and most companies choose a combination of a few or even all possibilities.
However, the key driver for choosing a particular option is the expected return from such an investment. Buybacks generate more returns when the company’s stock is undervalued, and other options offer less upside.
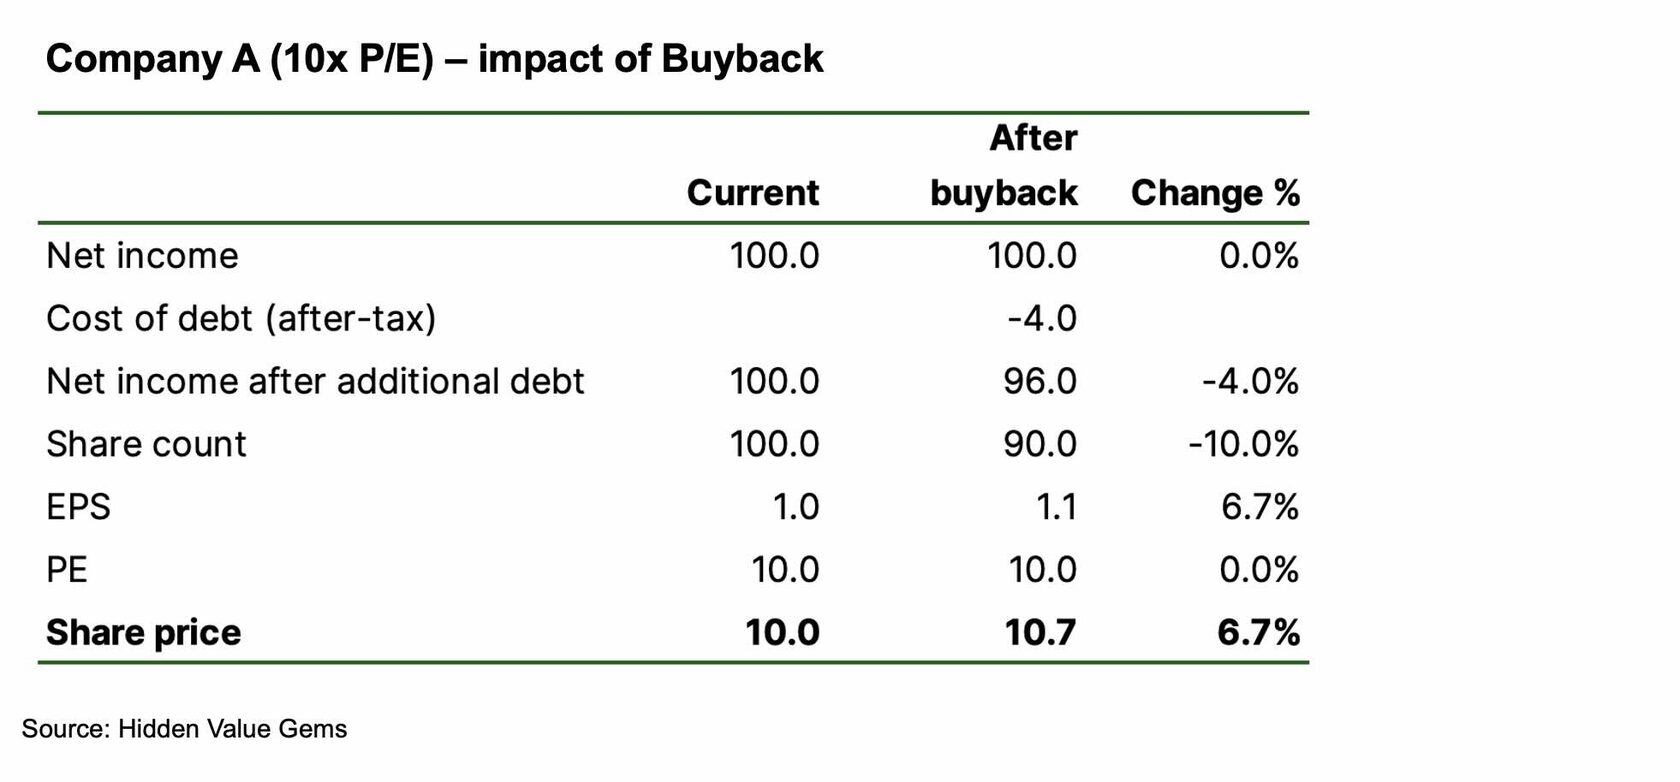
Suppose Company A has 100mn shares outstanding and generates stable earnings of $100mn a year (its EPS is $1). Let us assume it trades at just 10x P/E since it is not a fast-growing business. With an EPS of $1, its stock trades at $10.
Earnings are often a good proxy for FCF (Depreciation equals Capex, leading to a 100% cash conversion) for a mature company. This means that Company A can afford to spend all its earnings on buying back its shares in the market.
In theory, the company could reduce its share count by 10%. With $100mn earnings, its EPS would grow to $1.1 (10% higher). And unless the P/E multiple changes, the stock price would rise 10% to $11 ($1.1 EPS times 10x multiple).
However, in reality, the $100mn cash has some value as it could have generated a minimum return if invested in a risk-free asset (for example, a shareholder who received this money in dividends could put it on a bank deposit and generate some income). The simple way to include this opportunity cost into the equation is to assume that the company would have to pay interest on the changes in its net debt.
If the cost of debt is 5% (or 4% after adjusting for the 20% profit tax), then the net change in EPS will be 6.7%. Without the change in the valuation multiple, Company A could expect its share price to rise 6.7%, helped by the buyback. This is quite an achievement, given that the company is not growing its core earnings and can only do it through a prudent financial decision that has nothing to do with its business knowledge, market position, etc.
On the other hand, suppose another company (Company B) valued at 30x P/E decides to spend all its earnings on buyback. Without any money left for investments, its earnings will likely stay the same next year. In this case, the buyback would reduce EPS by a marginal 0.7%, making existing shareholders poorer. With the same earnings trajectory and cost of debt, Company B destroyed shareholder value.

When Buybacks do not work
The last example highlighted the dangers of share repurchases at high multiples. Of course, earnings do not often reflect the true value of the business. For example, Berkshire Hathaway’s earnings, even adjusted for considerable swings in the value of its equity portfolio, tell little about the underlying profitability as insurance profits are often volatile. Plus, the companies in which Berkshire holds minority stakes only contribute dividends, while their earnings are not consolidated. So Berkshire may look expensive on a P/E basis, but this is often misleading. Earnings of companies that are about to launch a new product also understate the future potential profits.
More critical than relative valuation is the type of business and the sector it operates in. A company with a highly innovative product that depends on high R&D spending would ‘waste’ share value by investing in its own shares even if they trade at a discount because, without the necessary expenditures in the core business, it may eventually lose its market position. Imagine if Nokia, facing a falling share price as Apple introduced its first iPhone in 2007, decided to plough all the capital into share buyback. Technically, it could have created artificial demand for shares and positively impacted the price for a while. However, the business would run out of cash much faster, leaving the company with no resources for future buybacks.
Cyclical companies also run the risk of launching buybacks during the good times, when earnings are elevated, which could even make valuation look attractive. However, buying shares at the cycle's peak exposes the company to considerable risks in the downturn. Imagine an oil company buying back its shares in 2010-2013 when oil price averaged about $100/bl. Then, when the oil prices crashed under $30/bl from 2014 until 2017, this company could face bankruptcy as it would burn FCF and fund its operations through new debt.
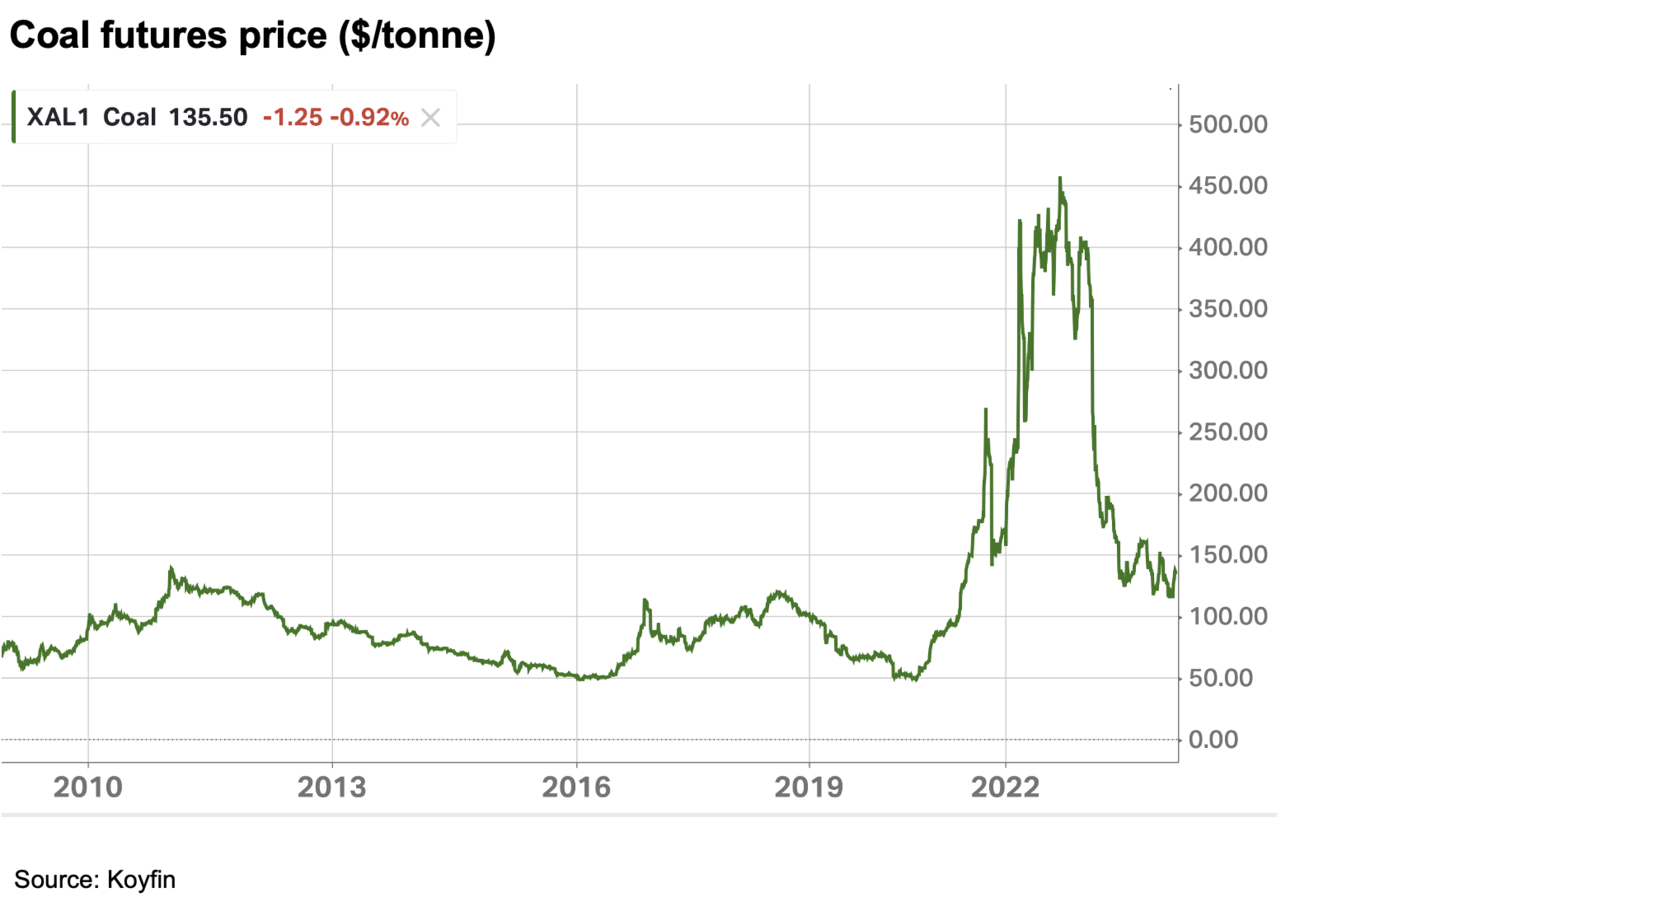
It is one reason I do not share the excitement of David Einhorn, who has a few cyclical names in his portfolio, and Mohnish Pabrai (who recently bought a couple of coal producers). Coal producers claim $40/tonne cash costs (thermal coal), considerably less than $130-150/tonne spot prices. Market prices follow marginal cash costs except for rare periods of dislocations. Perhaps Einhorn and Pabrai have a particular view on the coal market, and these positions are more than justified then.
The sector that offers plenty of M&A opportunities is also not the right one for large buyback programmes. If competitors gain market share through acquisitions, the company that is buying back its shares risks being marginalised.
Finally, paying management with the company's shares (the so-called share-based compensation) has become quite popular. They are excluded from 'adjusted' earnings, which makes profits look higher. Moreover, unlike companies that pay management in cash, such businesses have extra liquidity and can afford buybacks. Essentially, they fund buybacks via shares issued to management or offset those share-based compensation schemes through buybacks funded with shareholder funds.
There are companies that can boast high single-digit buyback yields, yet their share count barely changes. Alibaba is one of those companies, although it seems to be increasing its buyback programme now.
Conditions that make Buyback successful
Buybacks work best in stable, non-cyclical industries with limited growth opportunities or M&A. The company should have an established position, strong visibility of future earnings, and relatively inexpensive stock. The buyback should not increase the company’s leverage to dangerous levels.
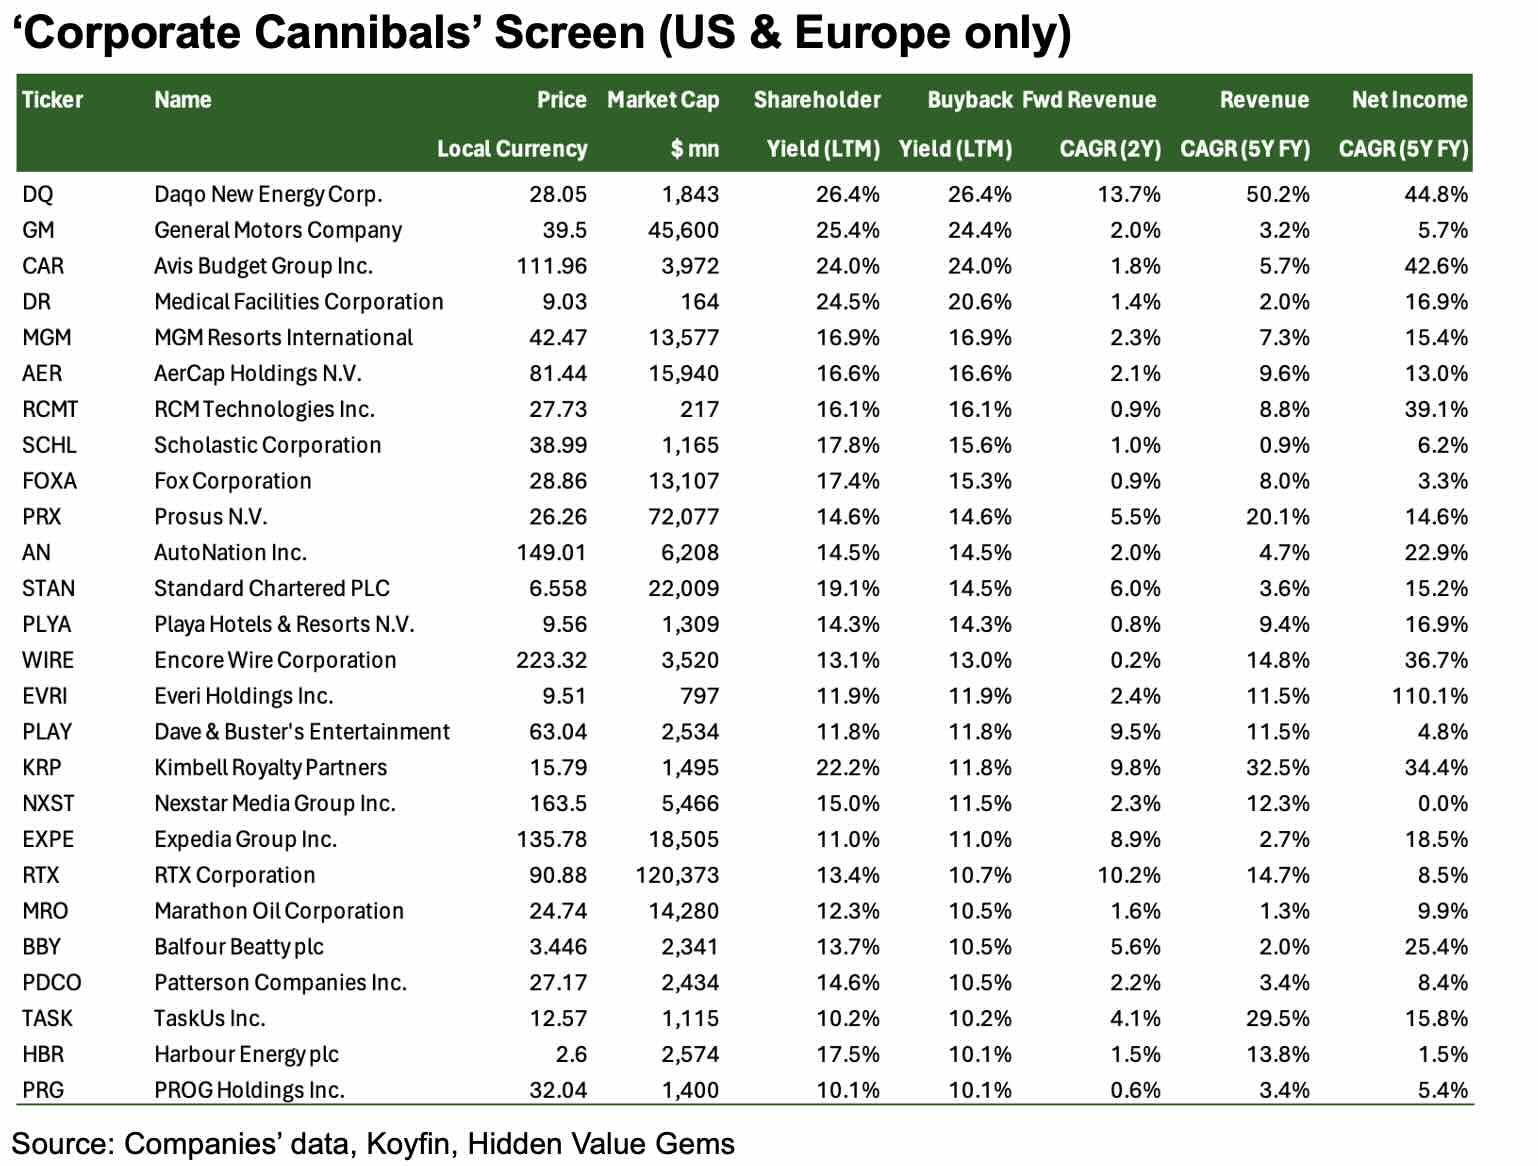
In the following section, you will find some names from the list of 150 biggest ‘corporate cannibals’—companies that reduce their share count at the highest rate. I removed stocks that have serious issues or where buybacks are not sustainable. The yield is based on Koyfin’s data for the past 12 months, but I suspect it is far from perfect, and some numbers may not need further verification. I excluded companies with falling sales and/or profits and weak growth prospects.
I focused on businesses that operate in stable industries, have some growth, and are attractively valued so that buyback can generate the highest returns. Next week, I will share more notes on other companies from this list.
Part II. Overview of select 'Corporate Cannibals'

Siminn hf. (ICX:SIMINN)
This Icelandic Telco ($191mn Mkt Cap) provides a full range of telecommunication services. 18% of shares are owned by an Icelandic family holding Stodir. The company has been an aggressive buyer of its own shares, reducing the net share count by a compound rate of 11% over the past ten years. However, the most recent buyback was undertaken as part of capital optimisation and does not match underlying profits or cash flows. The stock is at over 20x PE. There is also a currency risk.
Worth further research? No, let’s move on
Valvoline (NYSE:VVV)
This $5.7bn Mkt Cap company provides car services across the US, mostly related to motor oil exchange. Founded in 1866, it has 1,890 service centres (including 995 franchised) and is one of the largest in a highly fragmented market.
With a market focused on EV growth, it is understandable why investors can be sceptical about Vavloline’s future. However, the company has been rapidly expanding its offering for EVs. Besides, ICE cars may not leave the roads for many years ahead. Arguably, they could even see increased demand for services if new models are primarily electric, leaving owners of traditional ICE cars with no other option but to stick to their vehicles and maintain them for longer.
With a market focused on EV growth, it is understandable why investors can be sceptical about Vavloline’s future. However, the company has been rapidly expanding its offering for EVs. Besides, ICE cars may not leave the roads for many years ahead. Arguably, they could even see increased demand for services if new models are primarily electric, leaving owners of traditional ICE cars with no other option but to stick to their vehicles and maintain them for longer.
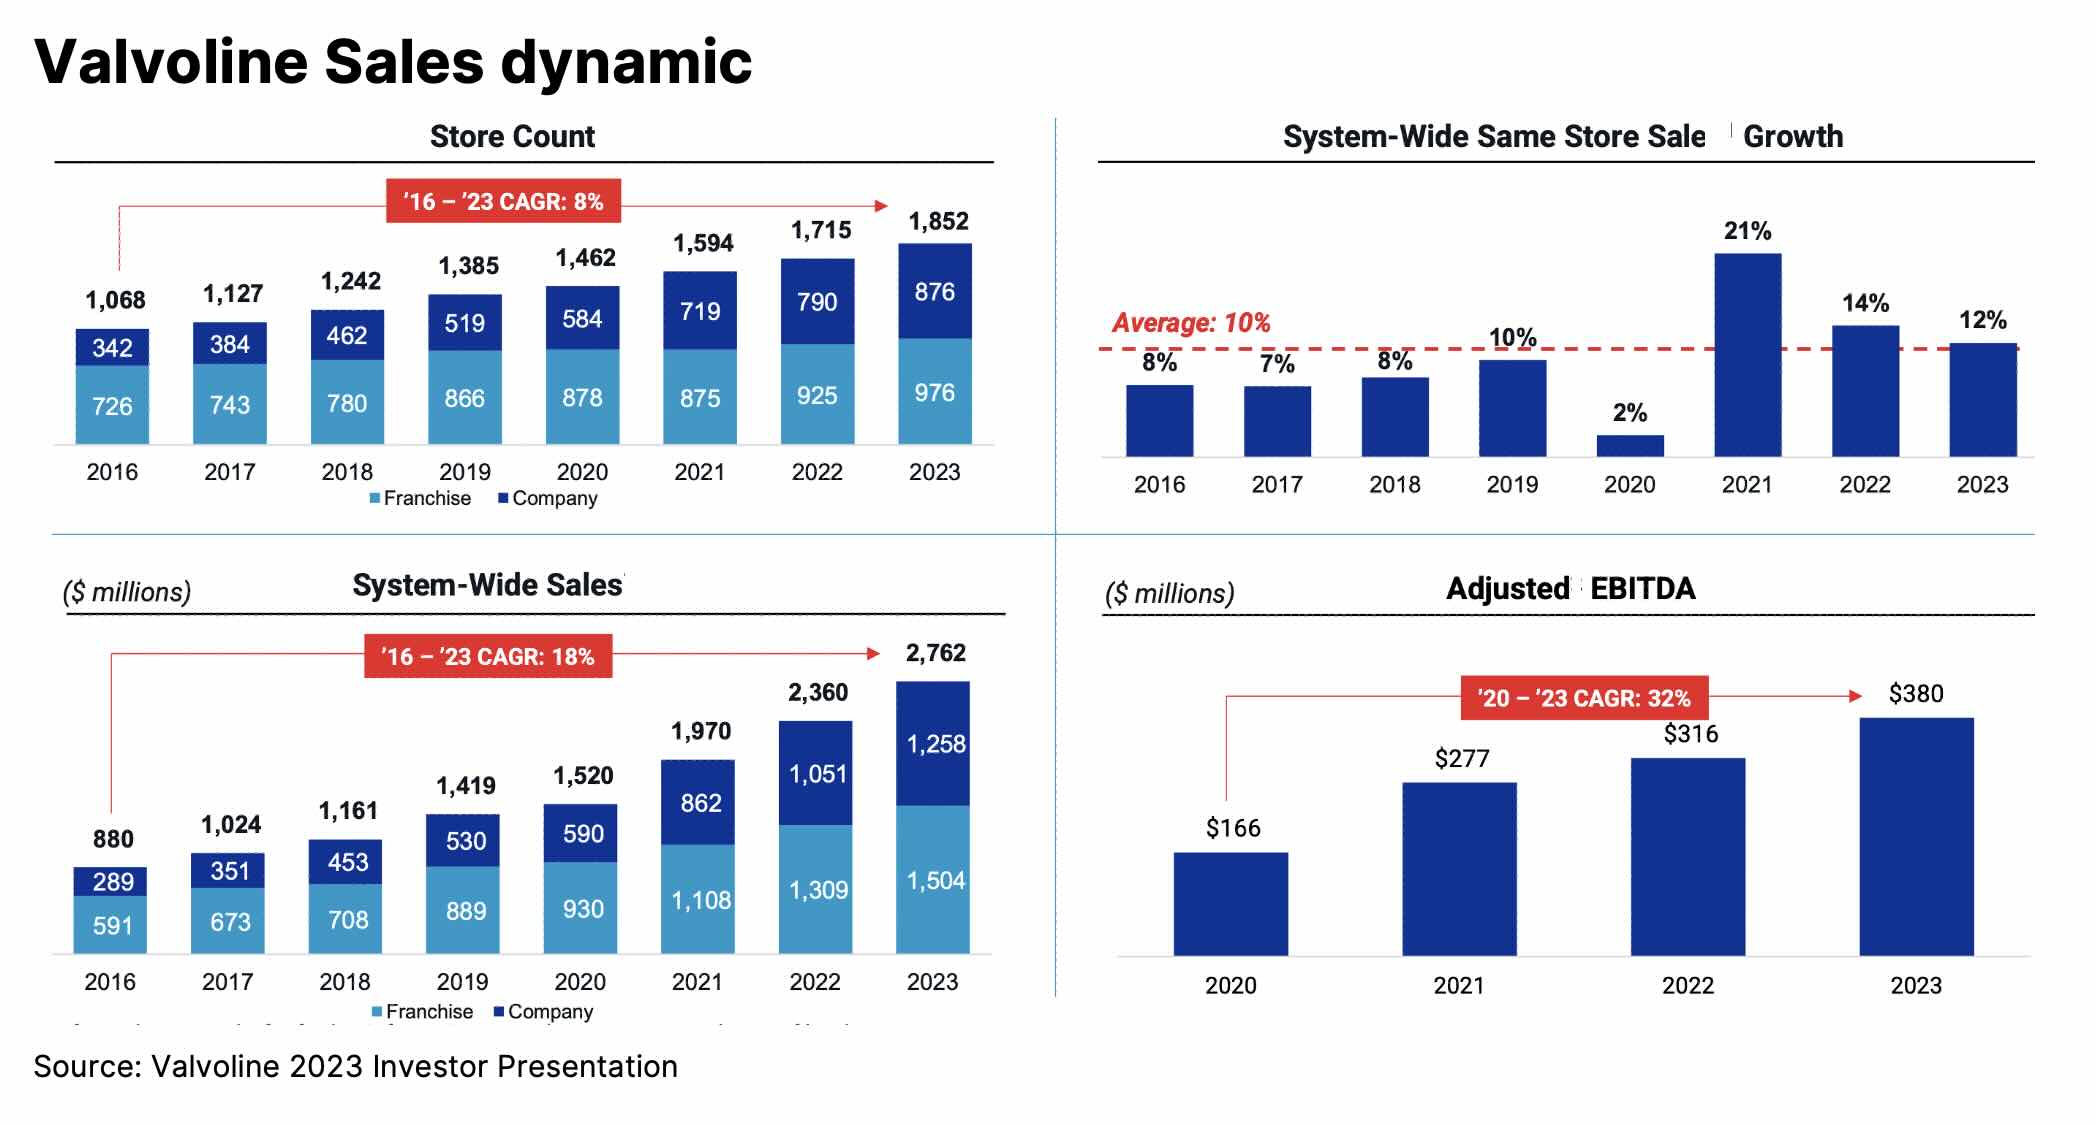
The company funded most of its share repurchases in 2023 ($1.6bn) via the proceeds from the sale of Global Products (lubricants) to Saudi Aramco for $2.65bn in cash.
The underlying cash generation of the remaining business is about $150-200mn of FCF a year, translating into just 4-5% FCF yield. The company has a net debt position, which means it can no longer distribute excess cash.
The underlying cash generation of the remaining business is about $150-200mn of FCF a year, translating into just 4-5% FCF yield. The company has a net debt position, which means it can no longer distribute excess cash.
Worth further research? Yes, because of strong organic growth and mid-term targets
Canadian Tire Corporation (TSE:CTCA)
CTC is a 102-year-old company that has evolved into a diverse business group comprising gasoline stations, tyre distribution centres, retail brands and stores, and financial services with 2.1 million active customers. The company also listed its REIT (CT REIT) in 2013, with a market cap of c. $3.5bn. It currently owns 68.4% of CT REIT, and the market value of this stake in CT REIT is $2.4bn. CTC has a combined market cap of $5.9bn.
The company has a net debt of $6.4bn (CAD8.7bn). However, $4.0bn and $2.1bn are related to the Financial Services and CT REIT, respectively, leaving only $0.3bn in the Retail segment.
CT has consistently grown sales (10-year CAGR of 4%) and regularly buys back shares. Over the past ten years, it has reduced its share count by 4% a year, on average. The company has been profitable every year for at least ten years.
The founding family (the Billes Family) remains the majority shareholder in Canadian Tire with a 61.4% interest.
The company prioritises investments in its core business with a balance of dividends and buybacks as part of its capital allocation strategy. CTC has consecutively grown its dividends for 14 years. It has announced CAD7/share annual dividend for 2023 (5% yield). Its 10-year compound dividend growth is an impressive 16.6%.
Unfortunately, Koyfin's 16% buyback yield is a mistake. The company spent CAD376mn and CAD425mn on share repurchases in 2023 and 2022, respectively. It has reduced its share count by 8% over the past two years. Still, it's not bad, given the dividend and growth profile. The company plans to spend at least CAD200mn on share repurchases in 2024.
Worth further research? Yes, even though the actual yield is lower than shown, a family holding and a good combination of growth, dividends and buyback make it quite interesting
DHT - no - share count rising like crazy
DHT is a $1.8bn mkt cap company listed in the US that owns and operates crude oil tankers. The sector looks very promising as bank lending for building new fleets has dried up, which could solve the almost permanent issue of excess capacity. This could extend the current phase of record day rates by many years ahead, especially in light of the transformation in the flow of crude oil following sanctions on Russia.
DHT screens well on valuation metrics (forward P/E of 7.5x) and a shareholder yield of 10%.
However, my main issue is the extreme rise in the share count (at a 25% compound rate over the past ten years, exceeding sales growth). Regardless of the reasons, this is a no-go for me.
DHT screens well on valuation metrics (forward P/E of 7.5x) and a shareholder yield of 10%.
However, my main issue is the extreme rise in the share count (at a 25% compound rate over the past ten years, exceeding sales growth). Regardless of the reasons, this is a no-go for me.
Worth further research: No
NatWest
NatWest is the third-largest UK bank focusing on retail and corporate banking. Unlike its bigger rivals (HSBC and Barclays), it does not provide Investment banking services, which are much more volatile, could lead to large unexpected losses and often leave too much bargaining power to employees when splitting the final profits (banks frequently rely on ‘star’ bankers or traders who can demand substantial bonuses in order not to keep them working at that bank). Unlike internationally diversified HSBC and Barclays, NatWest is predominantly a UK-focused bank.
NatWest’s market share in retail current accounts is 15.6%, and 25% in corporate deposits. The bank accounts for 12.7% of UK mortgages and 20% of lending.
NatWest also owns a leading UK private bank, Coutts. The wealth management business runs £41bn AuM and generated £1bn of income last year (14.8% ROE).
The UK government saved the bank during the Global Financial Crisis, taking 84.4% of the economic interest in NatWest. The government has gradually reduced its stake through open market share sales and sales directly to the company. Currently, the government owns a 31.85% interest in NatWest and plans to sell its entire stake later this year.
NatWest started actively purchasing its shares from the market and government in 2019. After COVID (from the start of 2021), it has reduced its share count by 28%. In the past three years, the company returned £12.5bn of cash to shareholders via dividends (£5.8bn) and share buyback (£6.7bn).
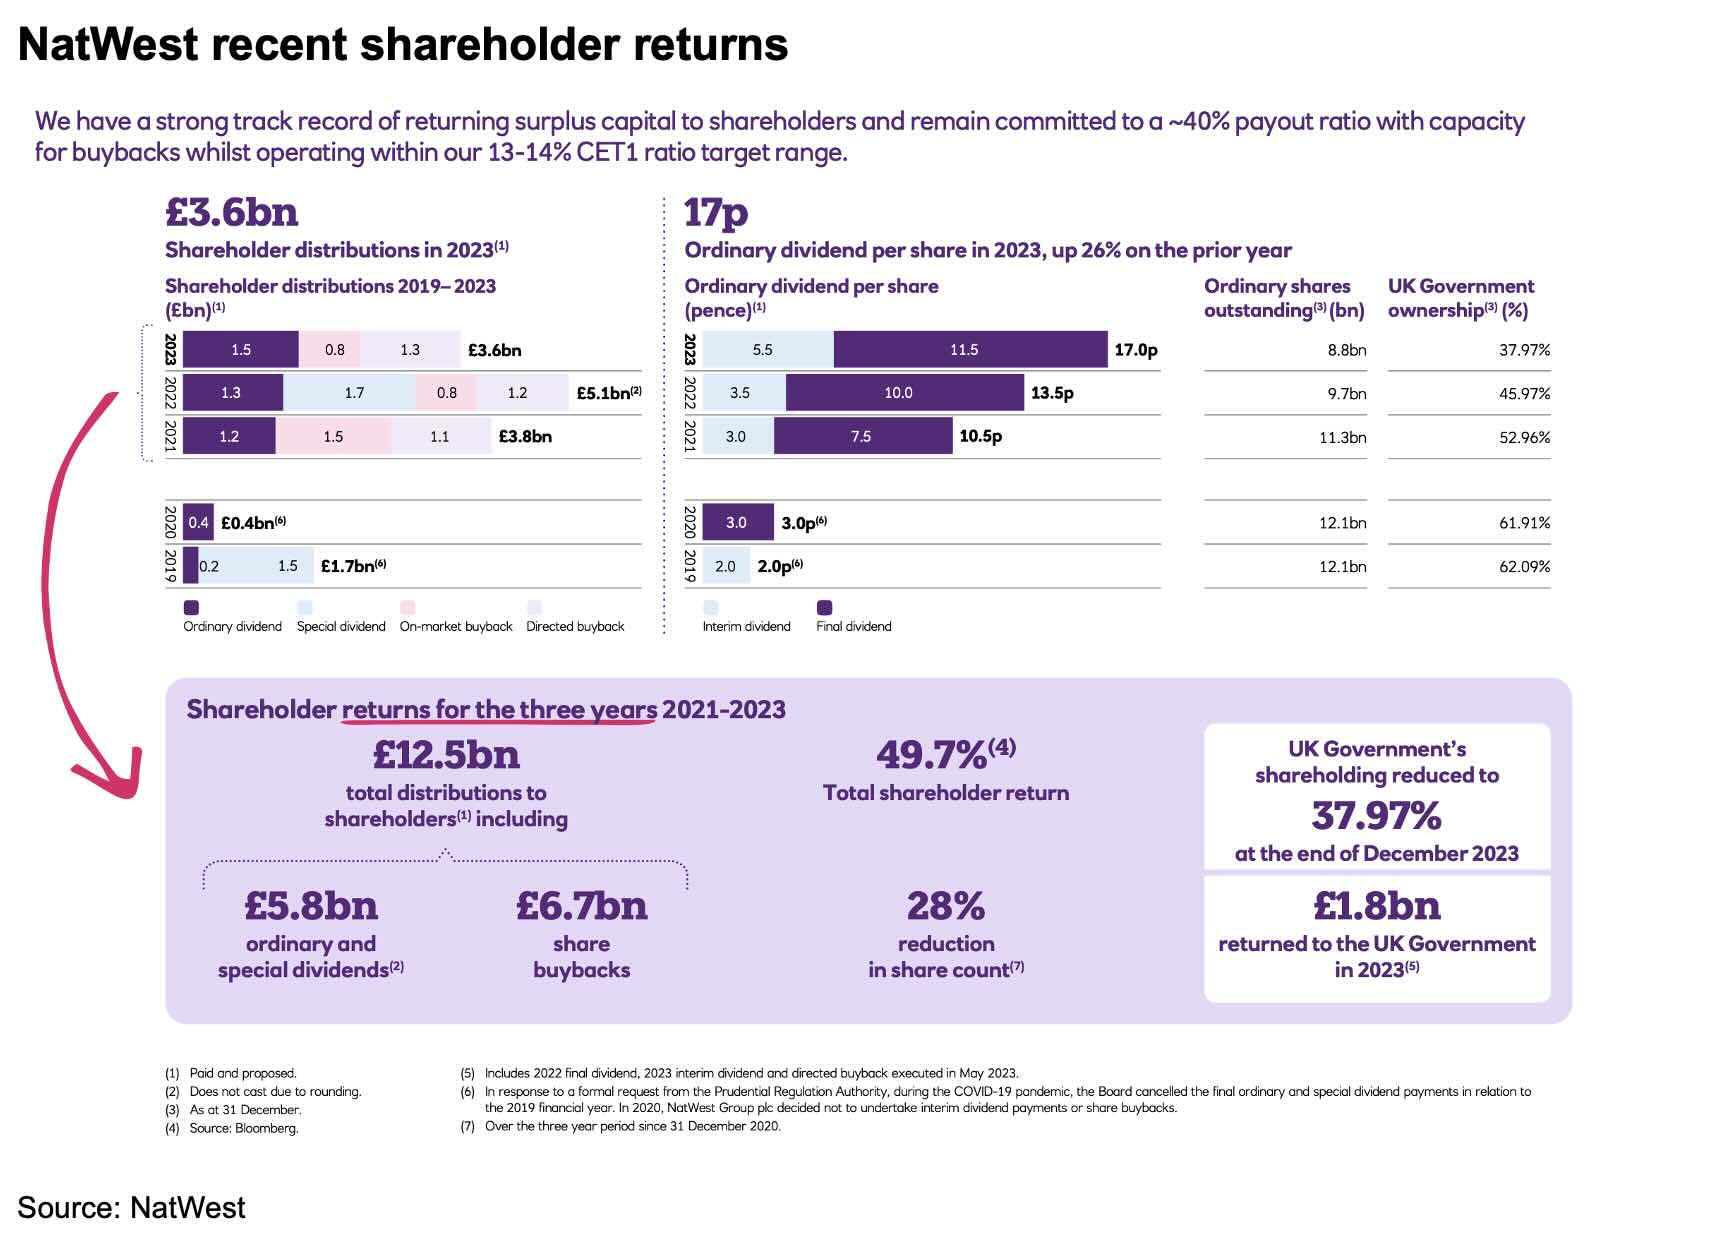
On 19 February 2024, NatWest launched a new £300mn buyback programme that will last until 18 July 2024
NatWest has materially improved its profitability. From loss-making operations during 2013-16 years, the bank moved to a mid-single-digit Return on Equity by 2019. In the past two years, it has earned 12.3% and 17.8% returns on tangible equity and had 14.2% and 13.4% Common Equity Tier 1 ratios in 2022 and 2023, respectively.
NatWest has materially improved its profitability. From loss-making operations during 2013-16 years, the bank moved to a mid-single-digit Return on Equity by 2019. In the past two years, it has earned 12.3% and 17.8% returns on tangible equity and had 14.2% and 13.4% Common Equity Tier 1 ratios in 2022 and 2023, respectively.
Worth further research: Yes
I plan to focus on other names, particularly MGM and AerCap, which look interesting. Other names, such as UK house builders, are also moving towards substantial increases in cash returns to their shareholders. They are worth researching further. I will cover the most interesting names next week.
Thank you for reading!
Thank you for reading!
Appendix
Thank you for reading. I hope you enjoyed this post. Please share it with people who may find it useful.


