


Guest Post: Today's write-up on Wise Plc is a guest post by the author of Grana Research and a portfolio manager at a multi-strategy asset management firm.
3 August 2025
As long-term readers know, I am searching for companies that stand out on the five key criteria (Great Product, Strong Financials, Low Leverage, Good Management and Attractive Valuation).
Today’s company meets at least four of these criteria.
Great Product. Wise’s cross-border payment services are not only the cheapest in the world and, in most cases, the fastest, but also are provided in a unique way. The company has built its proprietary payment network using direct connections to local payment systems in numerous countries.
As a result, Wise has eliminated intermediaries from the transfer process, which add to costs and time.
Moreover, the company keeps reinvesting profits into an even more competitive offering by continuously lowering its costs and adding new features. This strategy reminds me of Amazon’s playbook, where accounting profits were sacrificed for higher customer loyalty, larger scale and ultimately more value creation over the long term. Amazon was not the only company that followed such a model. Costco and, to a certain degree, Netflix are two other prime examples. Nick Sleep called this strategy ‘Scale Economies Shared’.
The strength of Wise’s model is also evidenced by the fact that other well-established banks have decided to use its network to offer faster and cheaper cross-border payments to their customers. The recent examples include Raiffeisen, Unicredit, Standard Chartered, Morgan Stanley, Itau and others. The share of revenue from providing its platform to other banks is currently 4%, with the aim of reaching 10% in the medium term and over 50% in the long run.
There seems to be little difference between an old sketch by Jeff Bezos and the chart from Wise’s 2025 annual report.
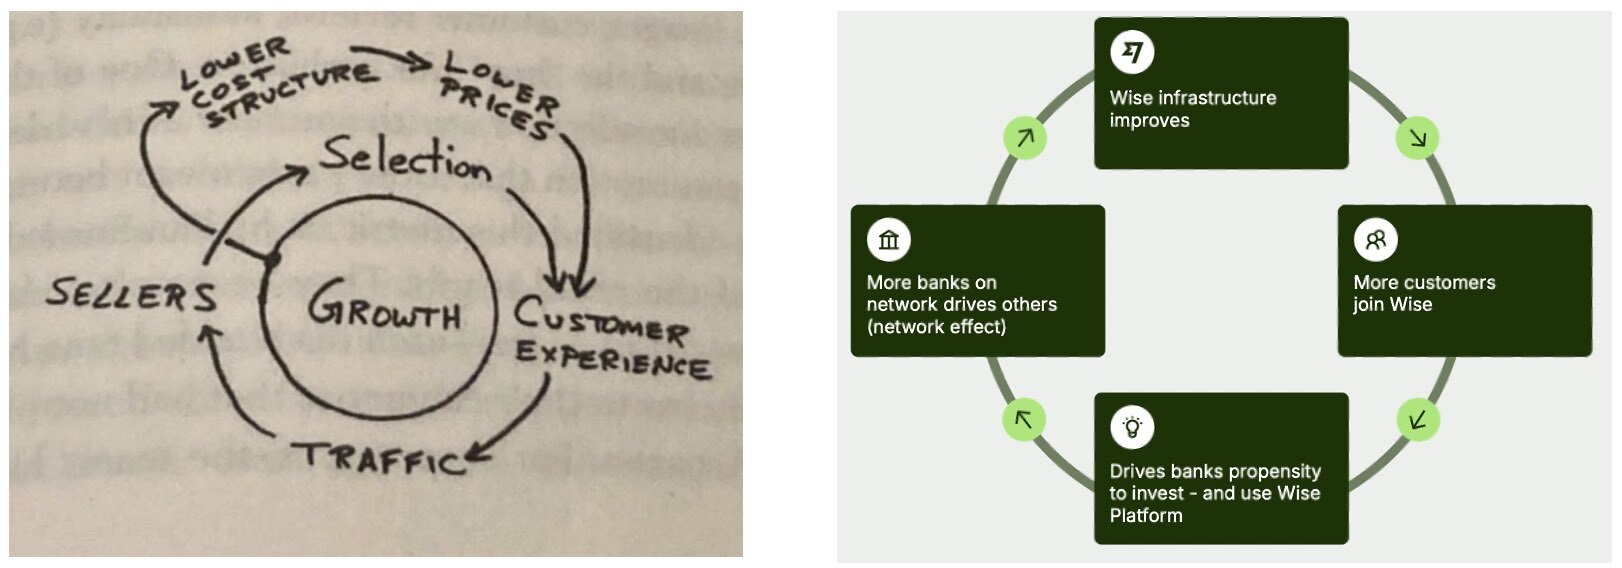
Source: The IGY Foundation, Wise FY25 Annual Report
Strong Financials. Wise’s five-year track record speaks for itself.
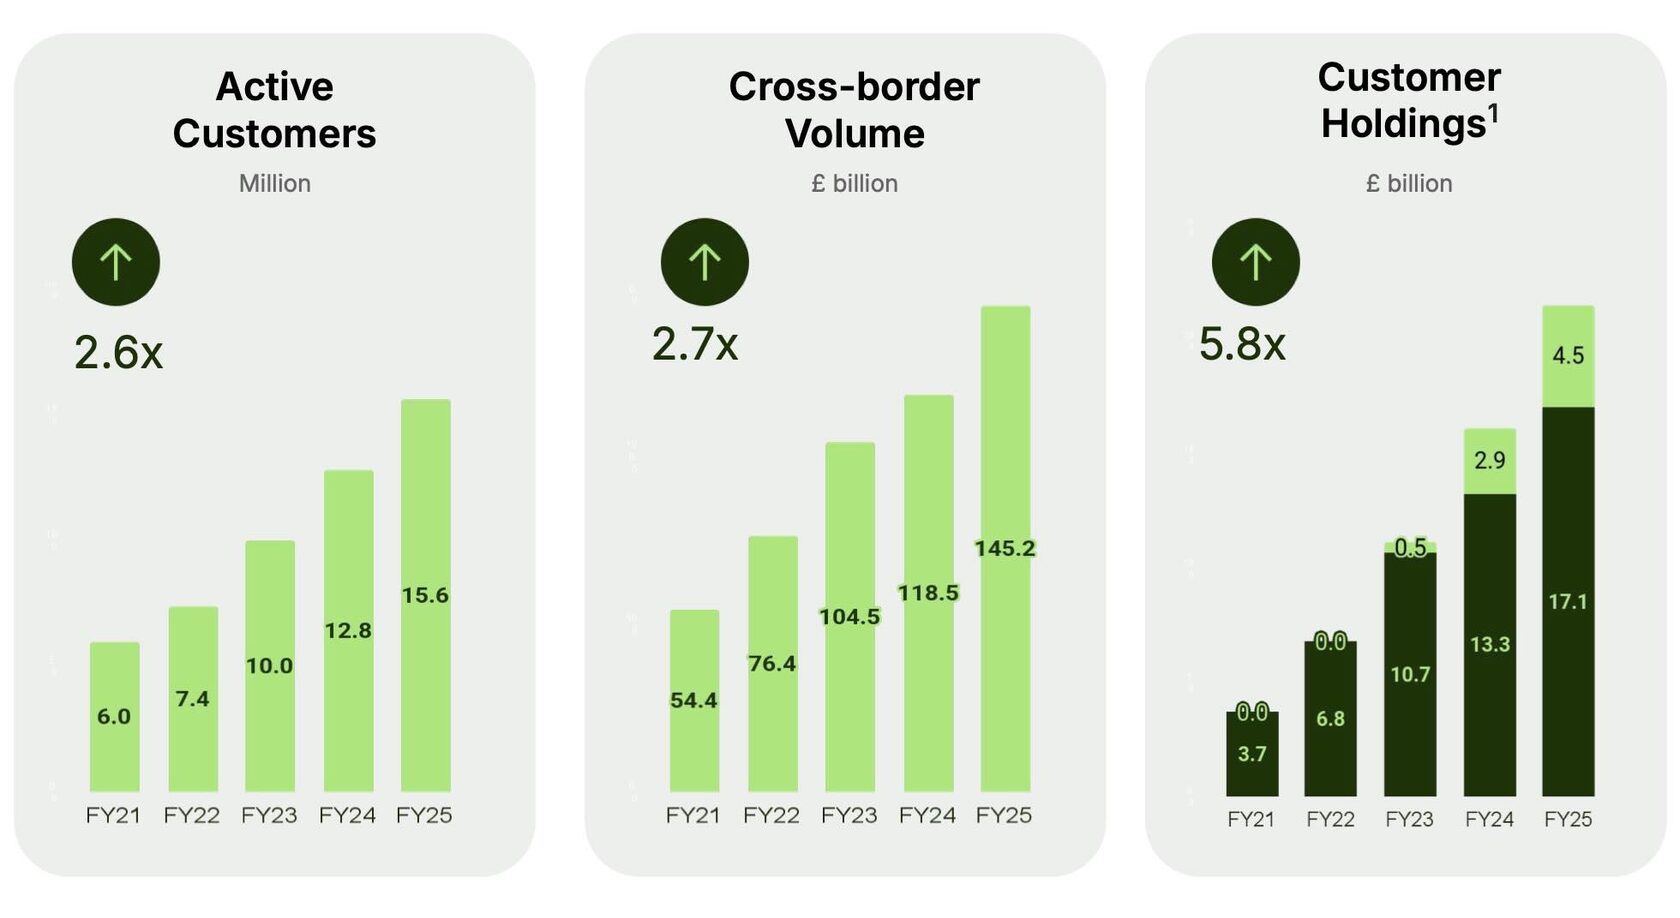
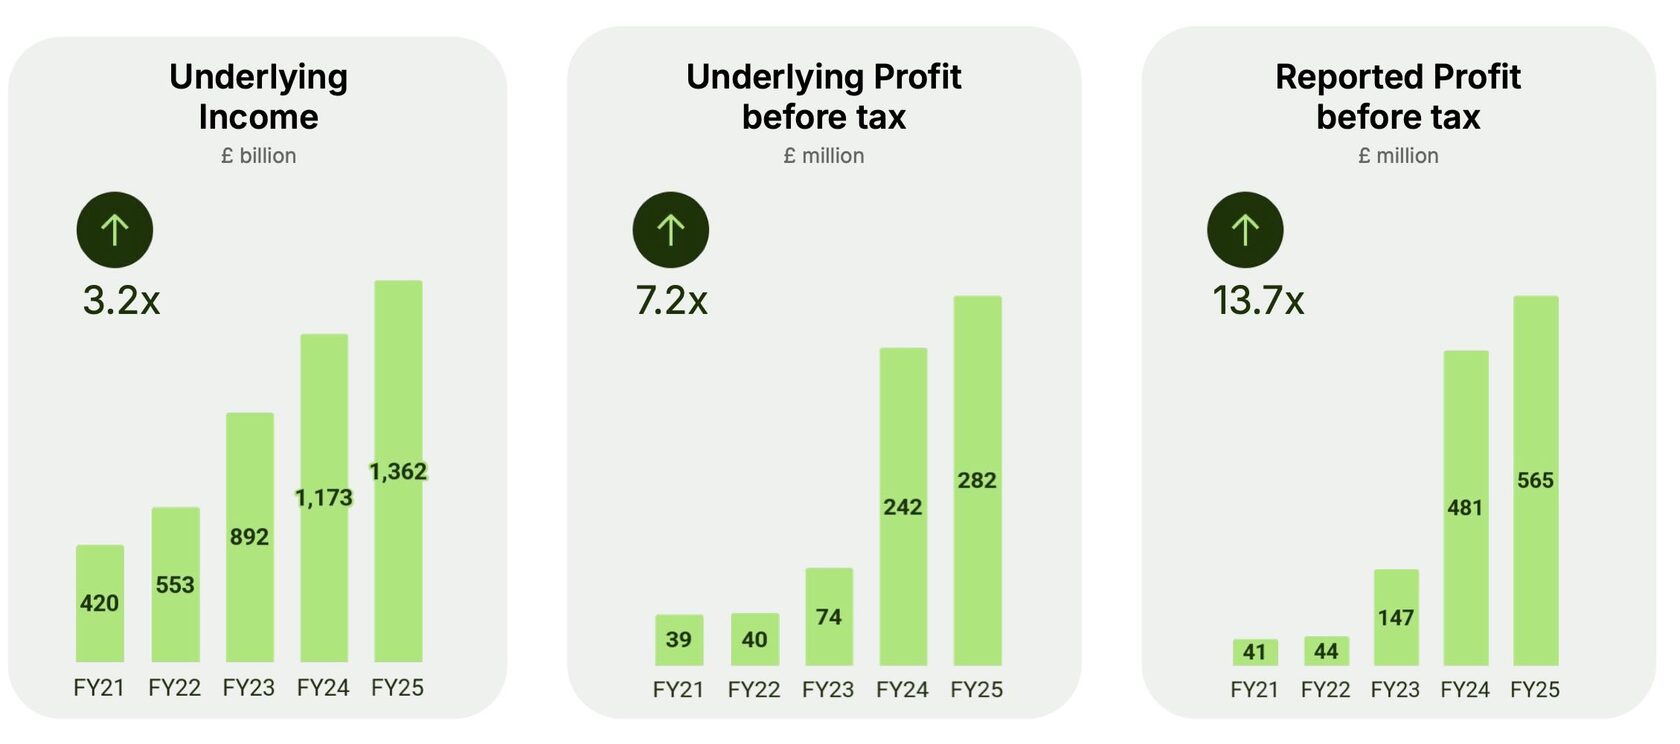
Source: Wise Plc
Leverage. The company had just £99.4mn debt as of 30 June 2025, practically zero.
Good management. Wise is still run by its co-founder, Kristo Käärmann, with a long-term vision to become "the" network for the world's money. Kaarmann is the largest shareholder with a 49.3% voting interest (29.5% economic).
Valuation. This is the trickiest question. Wise does not look cheap for a bank, trading on a forward P/E of 27.9x. However, its market cap of just £10.4bn is quite low compared to the private market valuation of Revolut ($75bn). As a fast-growing fintech disrupter, its near-term earnings are likely depressed due to the investment phase and a deliberate choice to forgo extra margins in return for a stronger moat in the long term.
Wise has long been on my watchlist, but I never had a chance to do proper research on it.
I was glad when a good friend of mine, a portfolio manager at a multi-strategy asset management firm, offered me to share his deep dive with my subscribers. He recently launched a Substack newsletter, Grana Research, focusing on GARP, deep value, and special situations. Like most of us, he does extensive research before initiating a position.
In his post below, you can find a detailed valuation analysis and insights on the Wise business model in one of the most comprehensive deep dives on the company.
If you like the post, I highly recommend subscribing to his recently launched Grana Research service on Substack.
- The remittance market consists of three main types of participants: banks, traditional money transfer operators (MTOs), and digital fintech platforms. Banks account for approximately 40% of the market, while traditional MTOs and fintech services each hold about 30%. Fintechs are rapidly gaining share due to their ability to offer lower transaction costs compared to banks and MTOs.
- Fintechs achieve greater cost efficiency through: (a) digital channels, which eliminate intermediaries at the customer interaction stage; and (b) liquidity management (local pools, netting), which minimizes the need for correspondent banks during the actual movement of funds.
- Wise (WISE.L; WPLCF) offers the lowest-cost solution in the industry: the average take rate for personal transfers is 0.57%, and for business transfers – 0.39%. The blended take rate stands at 0.52%, down from 0.64% a year earlier. For comparison, Western Union’s rate remains around ~3.5%, and Remitly’s at ~2.3%.
- The low take rate is a result of Wise’s advanced infrastructure, which took years to build. Replicating it is difficult, requiring dozens of integrations, licenses, and regulatory approvals across jurisdictions. This creates a strong competitive moat, which Wise continues to deepen by deliberately lowering its take rate as it scales.
- The low take rate drives higher transfer volumes and growing customer balances held in Wise’s multi-currency accounts – a key source of interest income. This creates a self-reinforcing cycle: lower fees drive volume growth, which in turn enables further price cuts, making Wise increasingly competitive.
- Wise has multiple growth levers. Its core business remains the B2C segment with the Wise Account, which drives growth in customer balances, card revenues, and interest income. The B2B segment (Wise Business) also holds significant potential, as the corporate remittance market is much larger and Wise’s current penetration remains low.
- Wise Platform enables fintechs and banks to embed transfers into their products. While it currently accounts for less than 5% of volume, it is already used by players like Morgan Stanley, Interactive Brokers, and Raiffeisen Bank, and could become a major volume growth driver. Management expects the Platform to reach 10% of total volumes in the medium term and over 50% in the long term.
- While Wise trades at a premium to most remittance peers, we believe current valuation levels are reasonable for initiating a position: the company is trading at a 2025 FCF yield (to EV) of ~4.61% and a 2026 yield of ~5.84%, with expected Free Cash Flow growth of 18.2% in 2026 and a projected FCF CAGR of ~17.2% through 2030.
- We include Wise in our cohort of high-conviction ideas with a target allocation of 10% of NAV. We are initiating one-third of the position at current levels.
- Our financial model for the company is available here.
The Company
The story of Wise began back in 2007, when Kristo Käärmann, a Big Four consultant living in London, and Taavet Hinrikus, then Director of Strategy at Skype, realized they shared the same problem: high currency exchange costs when sending money to and from their native Estonia. Hinrikus received his salary in Estonian kroons and converted them into British pounds each month; Käärmann did the opposite, converting his GBP salary into kroons.
The future co-founders came up with a simple solution: each month, Käärmann would top up Hinrikus’s UK account, and Hinrikus would do the same for Käärmann’s Estonian account, setting the amounts based on the mid-market exchange rate.
The idea quickly spread among other Estonian expats and evolved into a Skype chat group. In 2011, the informal money exchange forum transformed into TransferWise [1]. That same year, the company raised a $1.3 million seed round with participation from IA Ventures, Index Ventures, Max Levchin, and Peter Thiel. Since then, Wise has completed seven more funding rounds, growing from a startup into a public company with a valuation of £8.75 billion at the time of its IPO in July 2021 [2].
Today, Wise is one of the largest players in the industry, with a market share of less than 5% in P2P remittances and under 1% in small business transfers. Over the past four years, the company’s active customer base has grown 2.8x, cross-border payment volume by 2.9x, and revenue by 3.1x [3].
Wise remains founder-led. Kristo Käärmann is the CEO and owns 18.23% of Class A shares and 46.6% of Class B shares, giving him control of approximately 49.3% of total voting rights. Taavet Hinrikus left the company in 2021 but retained 5.4% of Class A shares and 8.4% of Class B shares, representing about 12.2% of voting power [4]. Class B shares do not grant rights to the company’s earnings but carry nine votes per share [5].
The Money Transfer Industry
The global money transfer market consists of two main segments:
- Personal transfers (P2P) — money sent between individuals. This segment is commonly referred to as remittances. While it accounts for a relatively small share of total payment volume, it generates a disproportionately high share of industry revenue due to steep fees. According to McKinsey, low-value cross-border transactions — including P2P remittances, small P2B, B2C, and SME B2B payments — represent only about 10% of global payment volume, which is estimated at $162 trillion in 2024 [6]. Yet, these small transactions are thought to generate up to one-third of total market revenue, thanks to a high average take rate of around 6.6% [7]. Wise estimates the annual remittance volume at $2 trillion [3].
- Corporate transfers — cross-border payments between companies, financial institutions, trade settlements, and more. This segment dominates by volume, accounting for 90%+ of global flows by value. B2B payments by large corporations and banks alone amounted to tens of trillions of dollars in 2024. The total volume of all cross-border business payments is estimated at $146–150 trillion annually [6]. These payments are typically processed through banks and the SWIFT correspondent network, with lower fees thanks to large transaction sizes. However, even in the corporate space, a clear divide is emerging: while large transactions remain with traditional banks, small and medium-sized enterprises (SMEs) are increasingly turning to fintech providers for smaller international payments. In fact, 35% to 50% of SMEs in North America, Europe, and emerging Asia have used non-bank fintech services for international payments at least once a year [6]. Wise estimates that small businesses transfer around $12 trillion annually, with this segment growing at a 9% CAGR over the past two years.

Structure of the Money Transfer Market; source: McKinsey [6]
The US dollar and the euro are the dominant currencies in the industry, facilitating the majority of global payment flows. According to SWIFT data, USD and EUR together accounted for over 70% of all international payments in 2024 [8].
The money transfer market is made up of three main types of players: banks, traditional money transfer operators (MTOs), and fintech platforms. MTOs and fintechs combined handle approximately 60% of global transfer volumes, while banks account for the remaining 40% [9].
Within the non-bank segment, fintech is rapidly gaining ground. In the 2010s, the majority of non-bank transfers were processed via offline networks like Western Union and other MTOs. By the mid-2020s, however, roughly 50% of all transfers were already being made through digital channels [10]. This trend is expected to continue, with the digital remittance market projected to grow at 16–17% annually through 2030, significantly outpacing the overall market growth rate of ~5–6% [11][12].
The disruptive nature of fintechs lies in their ability to offer significantly lower transaction costs compared to both banks and MTOs. For end users, the key parameters when sending money are the transfer fee and the exchange rate margin. According to the World Bank, the current average cost of sending money from G20 countries stands at 6.77% [11].
Below is a comparison of average fees for sending $200 based on provider type [7].
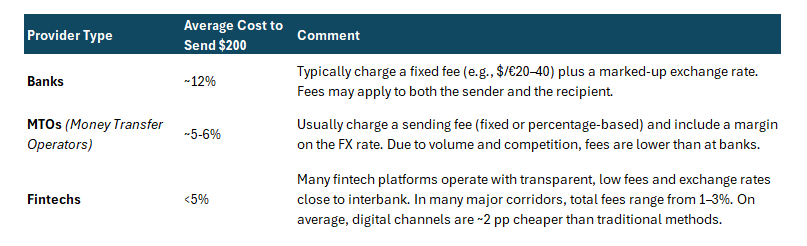
Comparison of Average Fees for Sending $200 by Provider Type (as of 2023); source: World Bank [7]
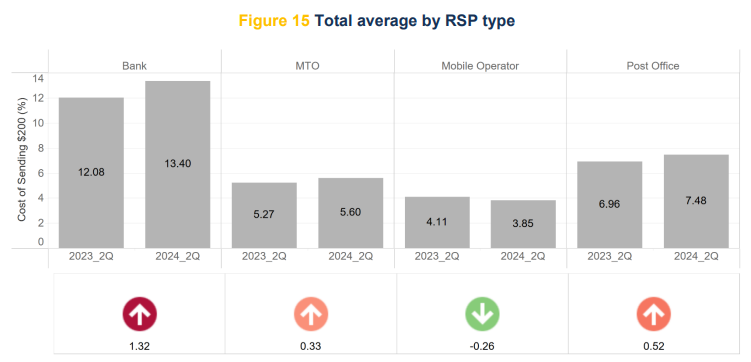
Average Remittance Cost by Type of Provider; source: World Bank [11]

Average Cost of Money Transfers From/To G20 Countries; source: World Bank [11]
Banks are the most expensive option. Their infrastructure relies on the SWIFT interbank messaging system and a network of correspondent accounts. In a cross-border bank transfer, funds move through a chain of institutions: the sending bank sends a SWIFT message to its correspondent (or directly to the recipient bank if a direct relationship exists), and the money is routed through Nostro/Vostro accounts — accounts that banks hold with one another to settle international transactions — before finally being credited to the recipient’s account. This process is relatively complex and can take several days, especially when multiple intermediaries are involved.
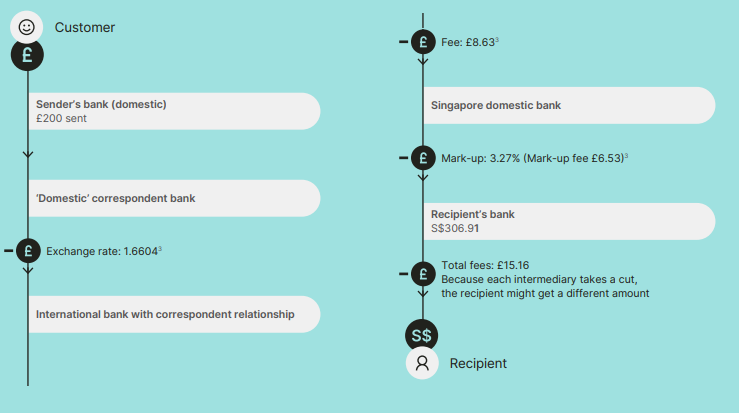
The Cost Chain in a Cross-Border Interbank Money Transfer; source: Wise [5]
It is precisely the fact that funds pass through a chain of intermediaries — each aiming to profit from the transaction — that makes the overall cost to the customer so high. Notably, since bank transfer fees are typically fixed, banks tend to earn more from the FX spread. This makes their pricing model less transparent.
Median Transfer Fees and FX Margins Charged by U.S. and European Banks on Money Transfers; source: SaveOnSend
The largest players in the bank-led segment of the money transfer market are primarily those with extensive international networks of subsidiaries. These subsidiaries allow banks to use their own internal FX rates and settlement systems, bypassing SWIFT and third-party correspondent banks. They also enable banks to act as correspondents for others.
The top banks by transfer volume include JPMorgan Chase, Bank of America, Wells Fargo, HSBC, and Citi. JPMorgan is the only institution with transfer volumes exceeding $25 billion. For comparison, Wise — the largest player in the non-bank segment — transferred $145.2 billion in 2025, up from $118.5 billion in 2024 [13].
The top banks by transfer volume include JPMorgan Chase, Bank of America, Wells Fargo, HSBC, and Citi. JPMorgan is the only institution with transfer volumes exceeding $25 billion. For comparison, Wise — the largest player in the non-bank segment — transferred $145.2 billion in 2025, up from $118.5 billion in 2024 [13].
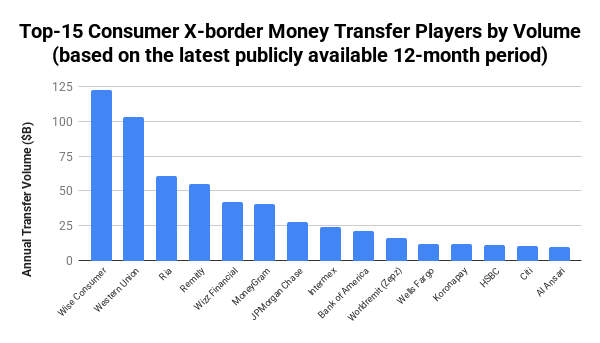
Top-15 Players in the International Money Transfer Market, by volume; source: SaveOnSend [12]
Traditional Money Transfer Operators (MTOs). This category includes companies such as Western Union WU 1.60%↑, MoneyGram, Ria (Euronet Worldwide, EEFT -2.75%↓ ), and numerous regional providers. Their infrastructure differs significantly from that of banks: MTOs have built their own global networks of agents and branches, enabling them to send and disburse cash nearly anywhere in the world within minutes.
At the core of an MTO system is a proprietary payment network. For example, Western Union operates over 500,000 service locations worldwide — ranging from urban branches to small agent outlets in rural areas. When a sender brings funds (in cash or by card) to a Western Union location, the agent enters the transaction details into the company’s centralized system. Within minutes, the information becomes available to the receiving agent, and the recipient can collect the funds almost immediately by presenting identification and the tracking number.
The actual movement of money occurs through a system of inter-agent settlements with the central company — typically using netting (offsetting incoming and outgoing flows) and periodic reconciliations between Western Union and its agents in each country. Other MTOs operate similarly.
Many traditional MTOs have expanded their infrastructure to include digital channels. Today, both Western Union and MoneyGram allow customers to send money via website or mobile app, with payment from a bank account or card, and receive funds not only in cash, but also via bank deposit, mobile wallet, or card payout. This brings their infrastructure and cost structure closer to those of fintech players.
However, the core of the MTO model remains a hybrid of a digital platform and an agent-based network. For instance, only 28% of Western Union’s revenue comes from digital channels, while 45% of its total expenses are still paid out as agent commissions [14].
Fintechs. The leading players in this category include Wise, Remitly RELY -1.74%↓, WorldRemit, as well as the fully digital segments of traditional MTOs. These providers were built from the ground up as digital and distributed platforms, with no need for physical branch networks. This gives them a structural cost advantage and allows them to offer lower fees to end users.
The core principle behind fintech infrastructure is managing local liquidity pools. For example, Wise maintains bank accounts or local partnerships in each country it sends money to or from. When a customer in the U.S. sends $100 to a recipient in India (in rupees) via Wise, the funds may not actually move cross-border. Instead, Wise credits $100 to its local U.S. account, and an equivalent amount in INR is paid out from Wise’s account in India to the recipient — effectively two local transfers.
The currency conversion is done at the mid-market rate, and Wise charges a fee on top. This creates a P2P-style liquidity pool, where funds flow through the platform without using SWIFT or correspondent banks — significantly reducing both cost and time. Other fintechs operate with similar models.
Here’s how a former Wise product manager explained the movement within liquidity pools in an interview on Tegus:
“You've got many teams in Wise who manage those liquidity pools, which means that they are forecasting and estimating how many yuan or Singaporean dollars or whatever will be needed for tomorrow. Actually, they're forecasting three, four days out. What they then do is go, "What's the likelihood of us getting pay-ins to have that amount? What is the gap? From which market should we transfer to top that up so that amount is correct for the payout estimate?" and then they make those transactions on the normal SWIFT network.
If you're looking at that, and let's just say they pay 4% for those conversions and they send maybe U.S. dollars to Singaporean dollars and they have to pay 4%, it's only about 10% is the gap. Effectively, they can turn that 4% into 40 bps because all they're doing is they're just topping up the difference. Even though they might be paying 4% to do that, because they're distributing it across the other 90% of liquidity that they had, the actual underlying cost drops down the 40 bps.”
In other words, effective liquidity pool management requires deep integration with banking infrastructure and local payment systems. Fintechs achieve greater cost efficiency in money transfers through two key mechanisms:
- Digital distribution, which eliminates intermediaries at the customer interaction stage — unlike traditional MTOs, where agents act as a layer between the company and the customer, adding cost.
- Liquidity management via local pools and netting, which minimizes the need for intermediaries (i.e., correspondent banks) in the actual movement of funds.
Their Margins is Our Opportunity
This quote is often attributed to Jeff Bezos, the founder of Amazon. And it perfectly captures the essence of the strategy that allowed the company to turn e-commerce — a business with relatively low barriers to entry — into a capital-intensive infrastructure “fortress.” For years, Amazon sacrificed margins in order to gain market share and strengthen its competitive moat by building a level of infrastructure that no one else could easily replicate.
In early April, during Wise’s Investor Day conference call, CEO Kristo Käärmann echoed that famous Bezos quote. Wise’s strategy in cross-border payments indeed mirrors Amazon’s approach — especially in its:
a) aggressive fee compression in pursuit of scale,
b) vertical integration, and
c) reinvestment into proprietary infrastructure.
Today, Wise has the lowest take rate in the industry (i.e., the fee it charges for international transfers). In FY2025, which ended on March 31, the average take rate for personal transfers was 0.63% (with average volume per active customer at £7.2k), while for business transfers it was 0.44% (VPC at £55.8k). The blended take rate came in at 0.58%, down from 0.67% a year earlier — a record low for the company, achieved without sacrificing operational efficiency [15].
On its website, Wise maintains a public comparison tool showing rates charged by different providers across currency corridors [16]. At first glance, the market appears crowded with competing offers at comparable price points. In the “USD/EUR” corridor, for instance, Wise trails behind Xoom (PayPal PYPL 0.80%↑), Instarem, MoneyGram, and Remitly.
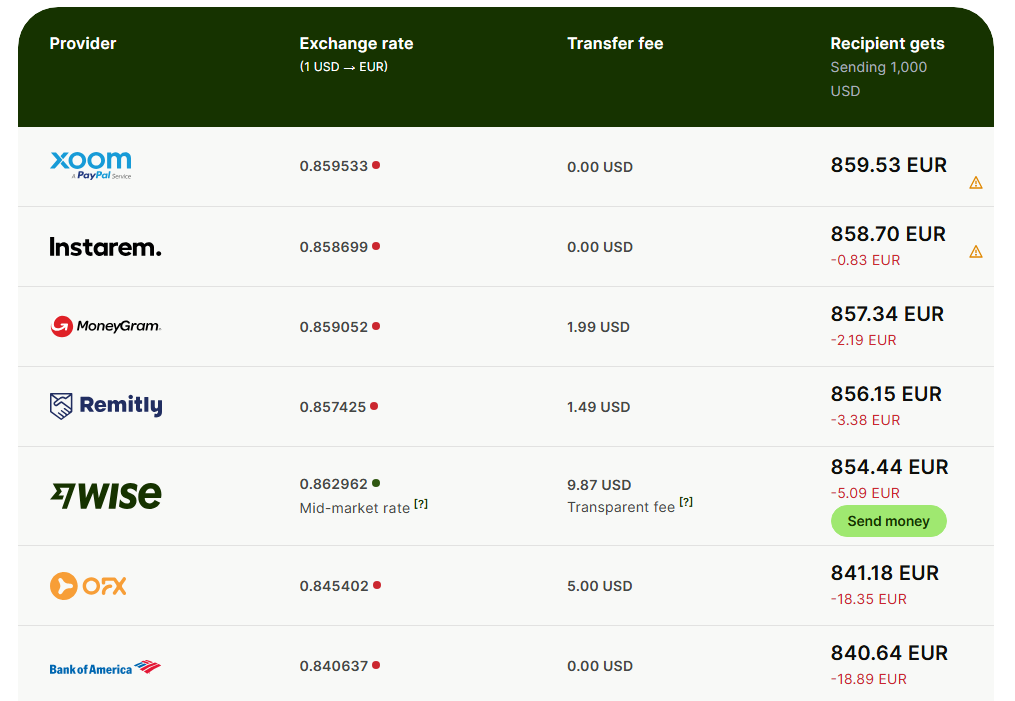
Fee Comparison in the USD/EUR Corridor; source: Wise [15]
However, competitors often subsidize their rates in the most competitive corridors by offering less favorable pricing in other markets. Wise deliberately avoids cross-subsidization — expensive or complex routes are not financed by the more profitable ones. Each corridor must be profitable on its own.
Management believes that price reductions should follow cost reductions, not precede them.
Management believes that price reductions should follow cost reductions, not precede them.
“Our pricing is a function of our cost to serve a corridor, plus a small margin. That is why we can keep reducing prices sustainably.”— Kristo Käärmann, CEO
Wise’s take rate is significantly lower than that of publicly traded competitors.
Western Union, the second-largest player in the money transfer market by volume, maintains a take rate of approximately 3.5% [16]. Remitly — Wise’s closest and effectively only major publicly listed fintech rival — operates with a take rate of around 2.3%. Given that private fintech competitors operate at a much smaller scale, their take rates are likely even higher.
Western Union, the second-largest player in the money transfer market by volume, maintains a take rate of approximately 3.5% [16]. Remitly — Wise’s closest and effectively only major publicly listed fintech rival — operates with a take rate of around 2.3%. Given that private fintech competitors operate at a much smaller scale, their take rates are likely even higher.
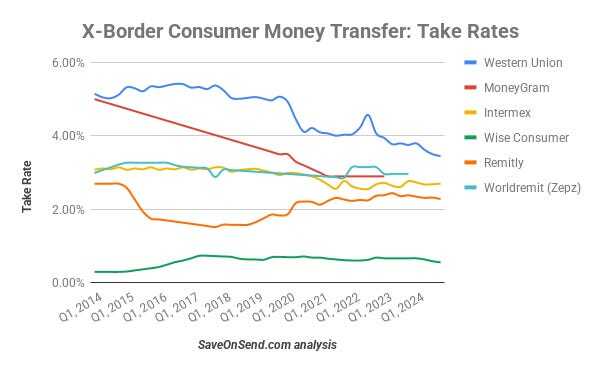
Take Rate Comparison; source: SaveOnSend [16]
Low fees are one of Wise’s key competitive advantages. Thanks to its pricing edge, the company has been steadily gaining share in the consumer remittance market.
Transfer Volume Trends Among Key Market Players; source: SaveOnSend [16]
The massive gap in take rates is primarily a result of infrastructure — infrastructure that took years to build. Wise holds over 70 Electronic Money Institution (EMI) and Payment Institution (PI) licenses, enabling it to provide money transfer services, hold customer funds, and issue cards across various jurisdictions. The company is integrated with more than 90 local banks and 8 domestic payment systems: FPS in the UK, SEPA in the Eurozone, GIRO/AFR in Hungary, Pix in Brazil, Zengin in Japan, FAST in Singapore, NPP in Australia, and InstaPay in the Philippines. Wise is currently working on a direct connection in the United States.
Direct integration with national payment systems removes unnecessary links in the transfer chain — whether correspondent banks or payment aggregators — allowing Wise to operate in these countries as a fully-fledged settlement participant. This dramatically lowers costs and speeds up transfers. For example, following its integration with the Philippines’ InstaPay system, up to 90% of Wise’s local transfers are now processed instantly, and the base cost per transaction dropped eightfold [17].
Why don’t other players replicate Wise’s infrastructure? Traditional banks avoid doing so for two main reasons:
You can read the full post by Grana Research here.
Direct integration with national payment systems removes unnecessary links in the transfer chain — whether correspondent banks or payment aggregators — allowing Wise to operate in these countries as a fully-fledged settlement participant. This dramatically lowers costs and speeds up transfers. For example, following its integration with the Philippines’ InstaPay system, up to 90% of Wise’s local transfers are now processed instantly, and the base cost per transaction dropped eightfold [17].
Why don’t other players replicate Wise’s infrastructure? Traditional banks avoid doing so for two main reasons:
- Money transfers account for a negligible portion of their business — roughly 0.5% of total bank revenue and around 1–1.5% of consumer banking revenue [18];
- Banks rely on a mutual “barter system” of services, where informal reciprocity replaces direct integration.
You can read the full post by Grana Research here.